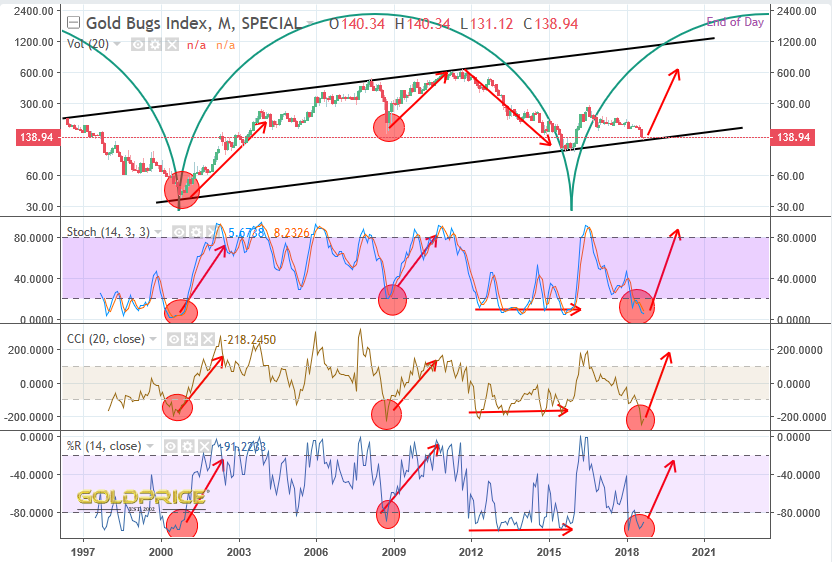
The Miners – Could They Be About To Fly ?
If you buy into the idea that 2016 marked the major cyclical low, and think the channel in the chart below is valid, then, maybe, just maybe. You’ll notice the 3 indicators shown on the chart are all hitting the kind of low values that usually mark a major turning point. The exception was 2012 to 2016, but that’s not surprising, because we were heading into that major cycle bottom. That meant that the indicators remained at very low values for a long, long time. I don’t believe that will happen now, as we’ve passed that cycle low and have tagged the bottom, support line. If this chart is valid, we could be about to see miners, double, triple and more over the coming few years. In fact, a gain of 500 to 800% is possible. How amazing would that be ? Maybe I’m dreaming but, the chart looks quite convincing to me.
In the meantime I am very happy with all my Cannabis related investments that are up nicely the last weeks. Regarding mining we need miners to produce gold at low costs like the Australian names, otherwise it will take at least 1600$ gold in order to have big money become interested in this sector again.The difference with sectors like Uranium or Cannabis, these sector have clear defined fundamental trends and that’s why big money invest in these sectors. I am afraid that’s not the case with gold.
The miners have been moving….(Spock Rocks) And Kirkland and many others.
Same as I just posted with North…Are you on twitter? Do I already follow you? scoremore@Scoremore_