Gold Indicators On 3 Different Time Frames
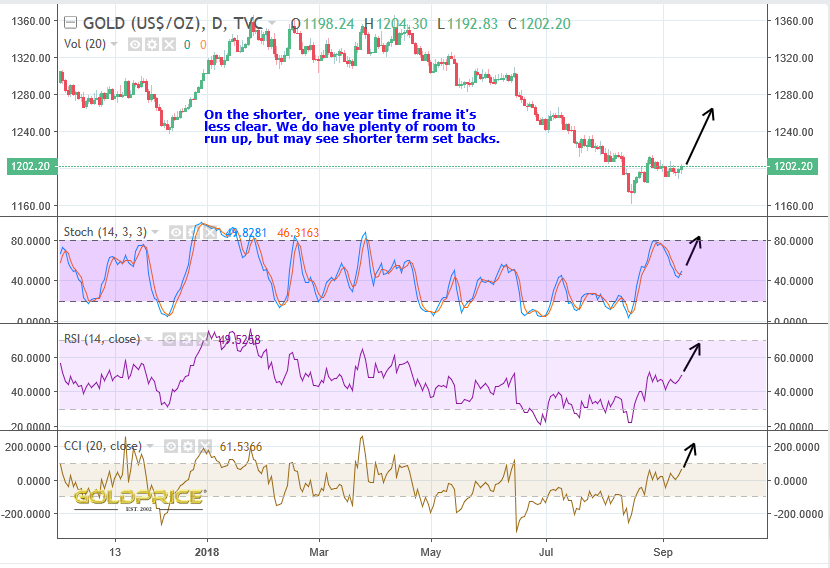
When looking at a selection of indicators, they can appear to suggest something different, depending on the length of time you are looking at. On a short time frame of just a year they can be giving a high or low reading that’s ‘out of sync’ with the longer timescale view. That’s just because shorter term volatility is common regardless of whether price is generally rising or falling. As the trend continues though, you start to see the indicators coming more into line, until eventually they all line up during a major low or high. Here’s what I mean…
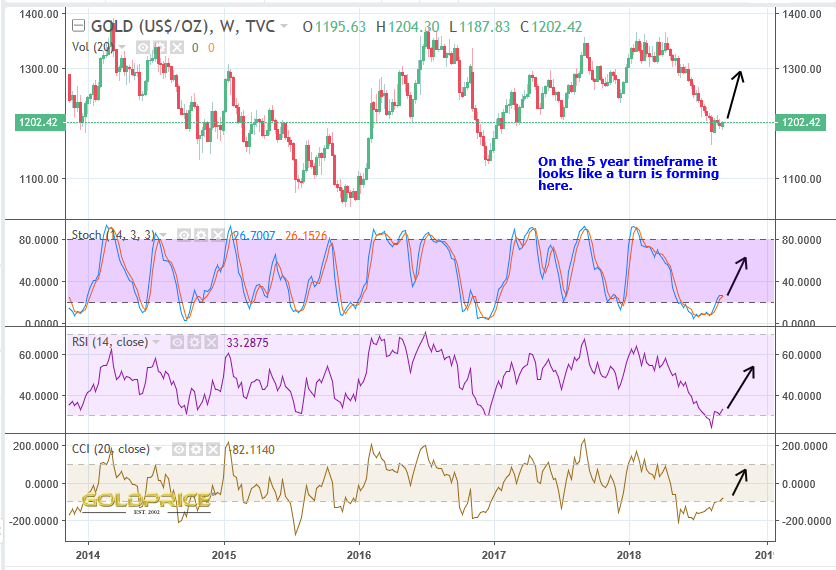
The 5 year view gives more clues…
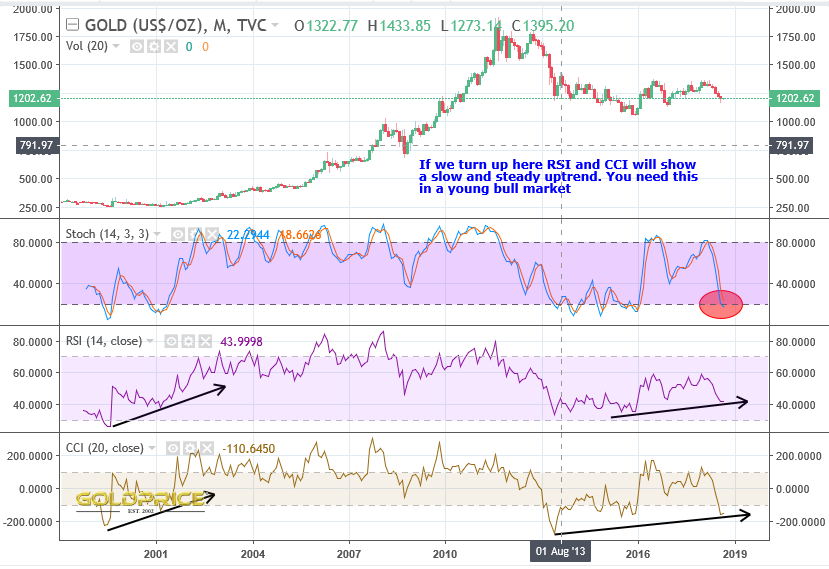
and this is backed up by looking back nearly 20 years
Could we move lower ? Of course, but the indicators are giving us a clue that we’re well positioned for an upturn here.
I told Fully last night that yesterday I took Rambus’s DSLV position, so gold should soar now! Got back out this am!
The big question after the inevitable bounce, is are we turning around or are we going to plunge to new lows.
Nice idea BUT … lets take the monthly as an example.
A more balanced picture emerges if you take one of these indicators, and mark every instance where you have that indicator turning up from near current levels. This looks to be about the eighth time on the Sto. How many of those “signals” never saw price drop further at a later date? Only two for sure (2001 and Dec 2015). Possibly 2000 as well.
Does that mean you don’t go for it here? A trade with stops if you’re wrong? Sure, why not?
As long as you realize you’re battling a bear market …… just like SPX shorts are battling a bull.
well said