Yield Curve
I haven’t looked at this chart in a while
Its the US 10 Year Bond Yield over the US 2 year Bond Yield
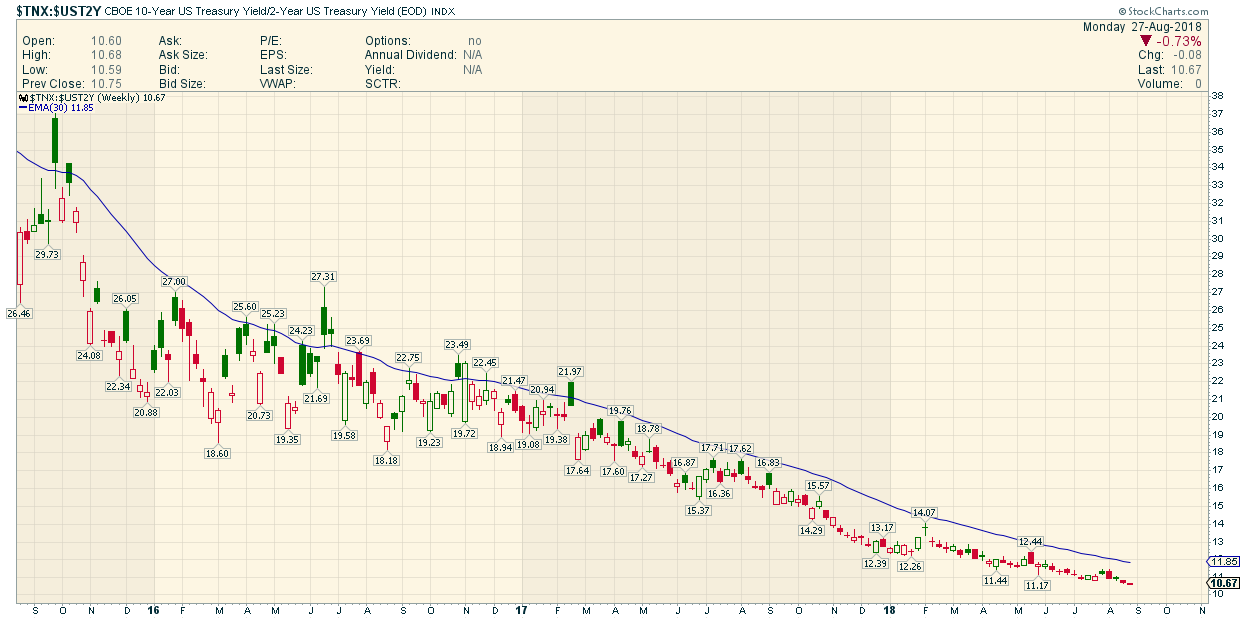
Most charts go up and down
This one is just relentless DOWN .
What does it mean ?
Bikoo99 ? Anybody ?
To me it means NO Infation…It means DEFLATION
gets a bit lower and pre signal of recession. Read a quip from Armstrong ” toward the end the yield curve inverts with short term rates exceeding long term rates”.
inversion is on watch. But inverted curve stay inverted for a long time and party can continue. See my post.