Gold action reaction lines and major pitchfork 2011-2018. Target(s)?
Well, I was disappointed when the gold price broken below $1230 because for me it meant big bearish news. I could be wrong but I still like my big Andrew’s pitchfork.
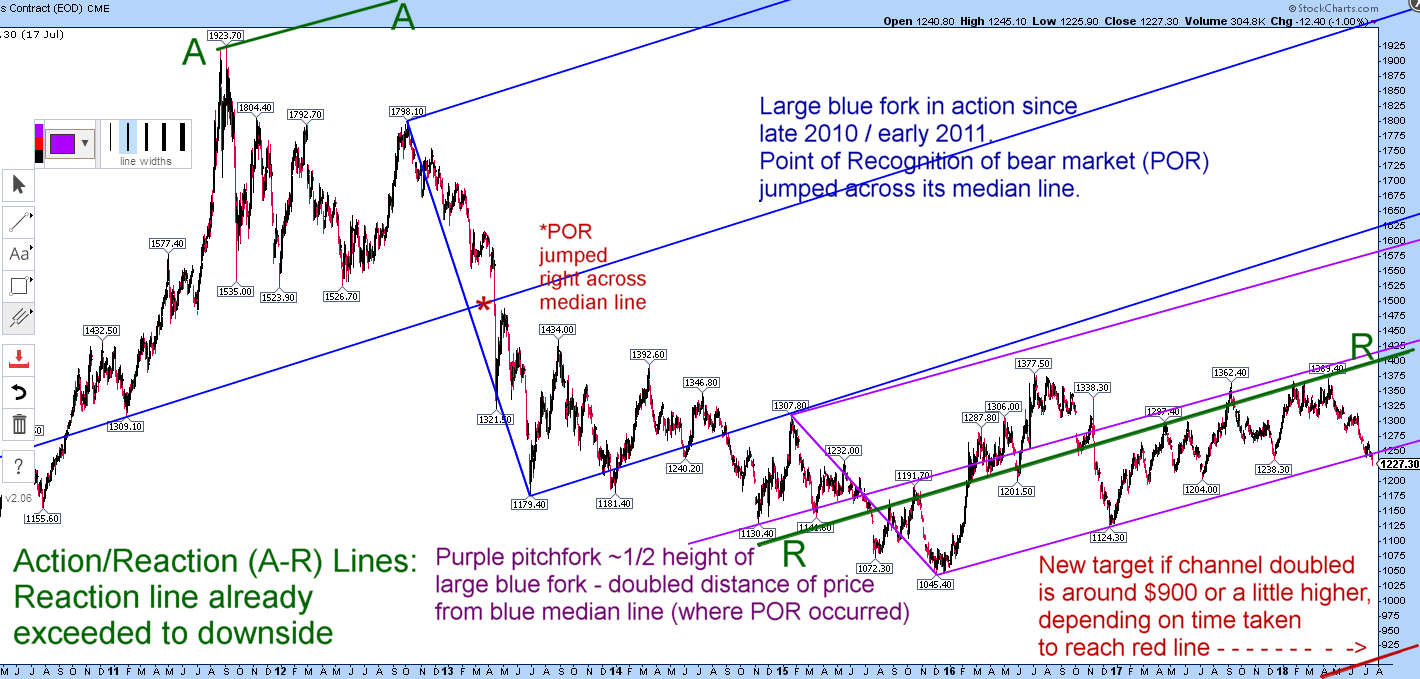
If it plays out, the bear market target will be about $900 if reached immediately (unlikely?) or about $80 higher than that for every year it takes to get to the sloping target line (red).
I had previously looked at action-reaction lines but the downside target for that was exceeded some time ago, although the shape/form of the price action would have suggested that $1045 in Dec 2015 was a likely bear market bottom.
In either case, price action had to hold at $1230 recently and it didn’t, so I remain unconvinced by any bullish commentary. It just looks like a long, long grind to me. However, if only the lower half of the smaller (purple) fork is doubled, then a re-test of the $1045 low is feasible (not marked) but would involve a slight break out of that channel, so that’s maybe a false hope. A move to around $1070 would be within that channel. That would perhaps in a way mirror the 1999 and 2001 lows in gold ($253 and $255, nearly 2 years apart) that signalled the start of the previous bull market.
If I do a slightly different construction, the large and small forks are almost exactly parallel. With the construction below, the smaller fork is a little slower rising than the large one – and that in itself has not really been a bullish indicator in my view.