Gold pitchfork action since 2010/2011 breaking down. Potential target $900+
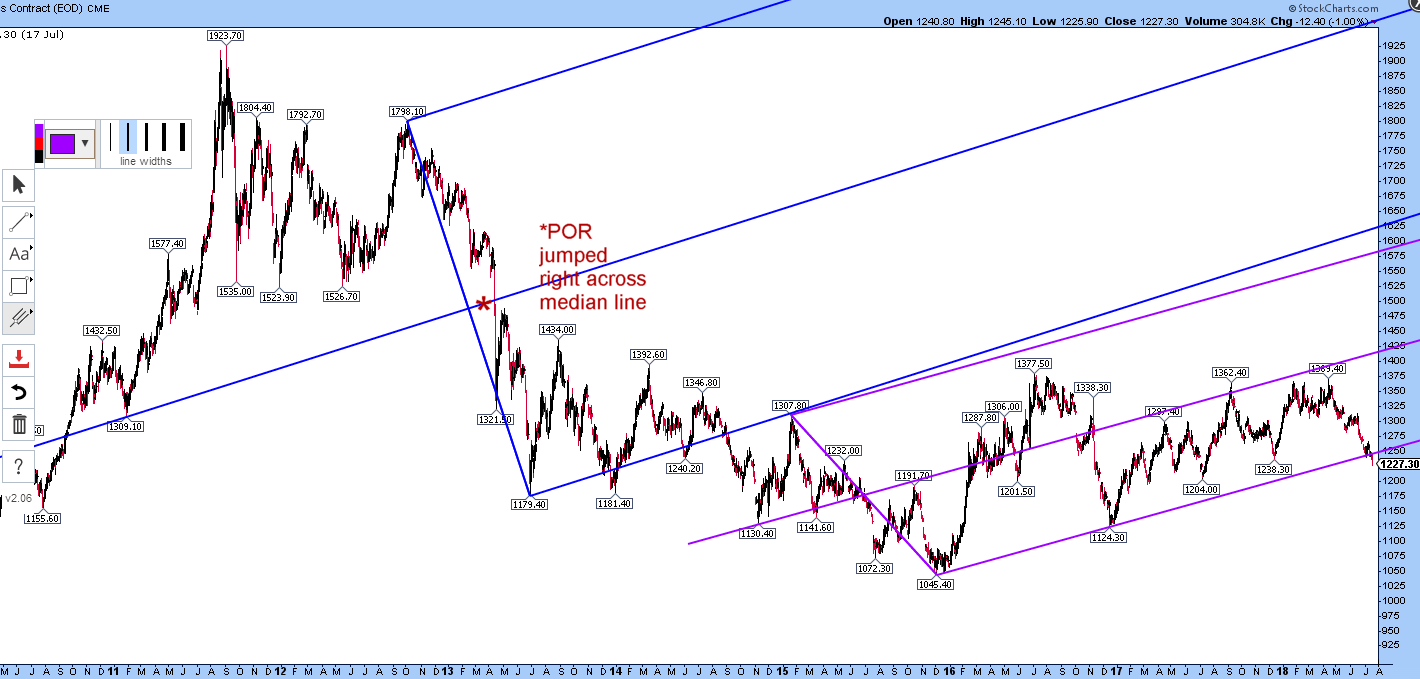
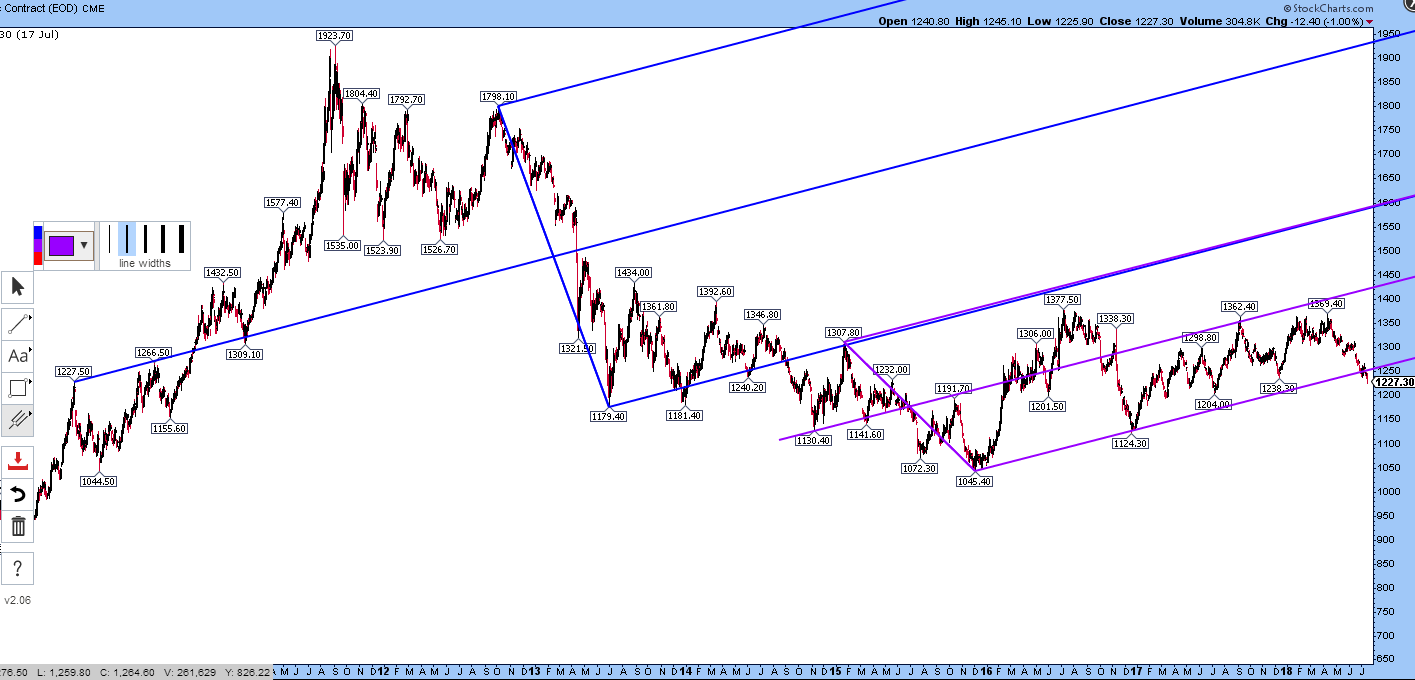
OK, I’m just going to post my old pitchfork structure that started in 2010/2011, depending on how it is drawn. The larger (blue) fork was broken to the downside way back when (end of 2013) and a new smaller parallel fork has been in action since the £1045 low in December 2015.
For me, the essentially bullish nature of the large, up-sloping fork that encompasses price action through practically the whole bear market, is very important. For the secondary fork to breakdown is potentially very bearish. If it’s not a false breakdown at the end of an oversold condition (a capitulation) followed by a good and fast second half 2018 rally, it looks very bearish for at least the medium term, possibly longer term. There would be potential for another move down the size of the width of the smaller fork for instance. It’s depth is about $325, (with the large fork at about $675 depth). A $325 move down from here ($1227) is a big one, though if it took some time, the upward slope would temper it a bit. So let’s say worst downside target is about $900 in this case.
James Dines used to call TA “visual analysis” and some people on here have said it’s best to keep it simple. A quick visual scan of the rolling over of this bear market rally takes the eye easily down to $900.
I know the $1224 level has been a key level for a long time too and multiple re-visits to this have already been made within the purple fork but this week is the first time that the price is in the $1220s ($1227 right now) outside this structure. It “shouldn’t” be there.
Pivot Points A,B,C for the large blue and small purple forks:
Large fork: (1227.50 or 1309.10), 1798.10 and 1179.40
1309.10 is more strictly correct but 1227 fits better with the later smaller fork.
At any rate, that run around $1309 in early 2011 was the start of the bubble run in gold and 1307-1309 has been a key price ever since, turning up many times.
In fact, $1307 also became a beautiful back-test of the large blue fork in early 2015! Price failed to re-enter it.
The large fork also encompasses major swing high at $1800 and low at $1180 and the Point of Recognition (POR) jumped right across the median line on 12-15th of April 2013. This is one of the key reasons why I have watched both this whole geometry very carefully.
Small fork: 1130.40, 1307.80, and 1045.40, about half the width of the large one so geometrically pretty neat in terms of channel widths.
It appears price has broken down out of this smaller fork and may possibly have back-tested it already – or maybe a back-test is to come? Actually, I think it hasn’t back-tested it yet if you draw the thing on a larger scale: there was just a first attempt to hold the line around $1238 and then a second failed attempt and then the fall below the line. So, back-test to come? That would mean gold going to the $1240 area at some point? I think I drew the purple pitchfork just a little high on these charts actually…
I haven’t even looked at the price today. I’m not trading it at all. I’m just a lurker!