First Post in a While
Greetings. I see the gold charting trying to find “the bottom” is still well under way. I only buy gold 2X per year, the seasonal July top in the equity market (July 22 on average) and December 15 after the 4th Quarter Fed announcement.
I now show you pure sorcery based on Camarilla Pivots, and why the pros use them.
XAUUSD (Week)
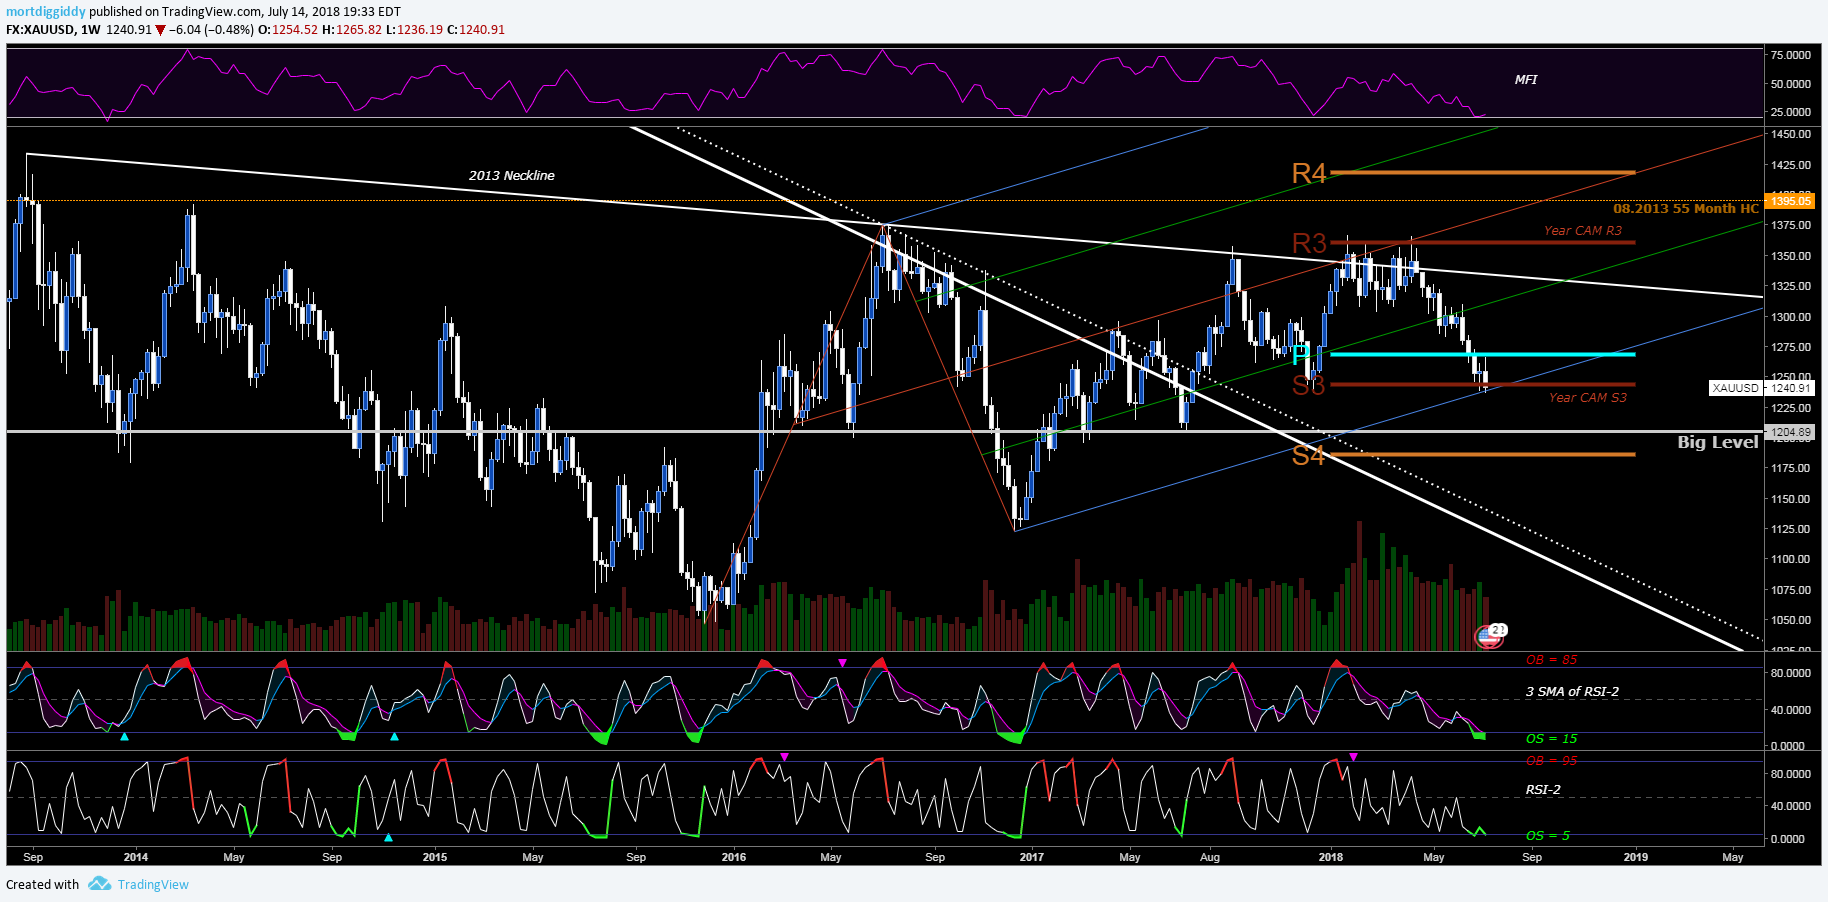
This is the busiest chart I will show and for a reason.
- 2013 Neckline shown
- Schiff pitchfork that perfectly fits the current weekly data
- Gold range for 2018 has been near perfect CAM (Camarilla) R3 to S3. This is classic CAM strategy.
- MFI (top indicator) oversold
- Larry Connors RSI and RSI-2 at bottom oversold
DXY (Day)
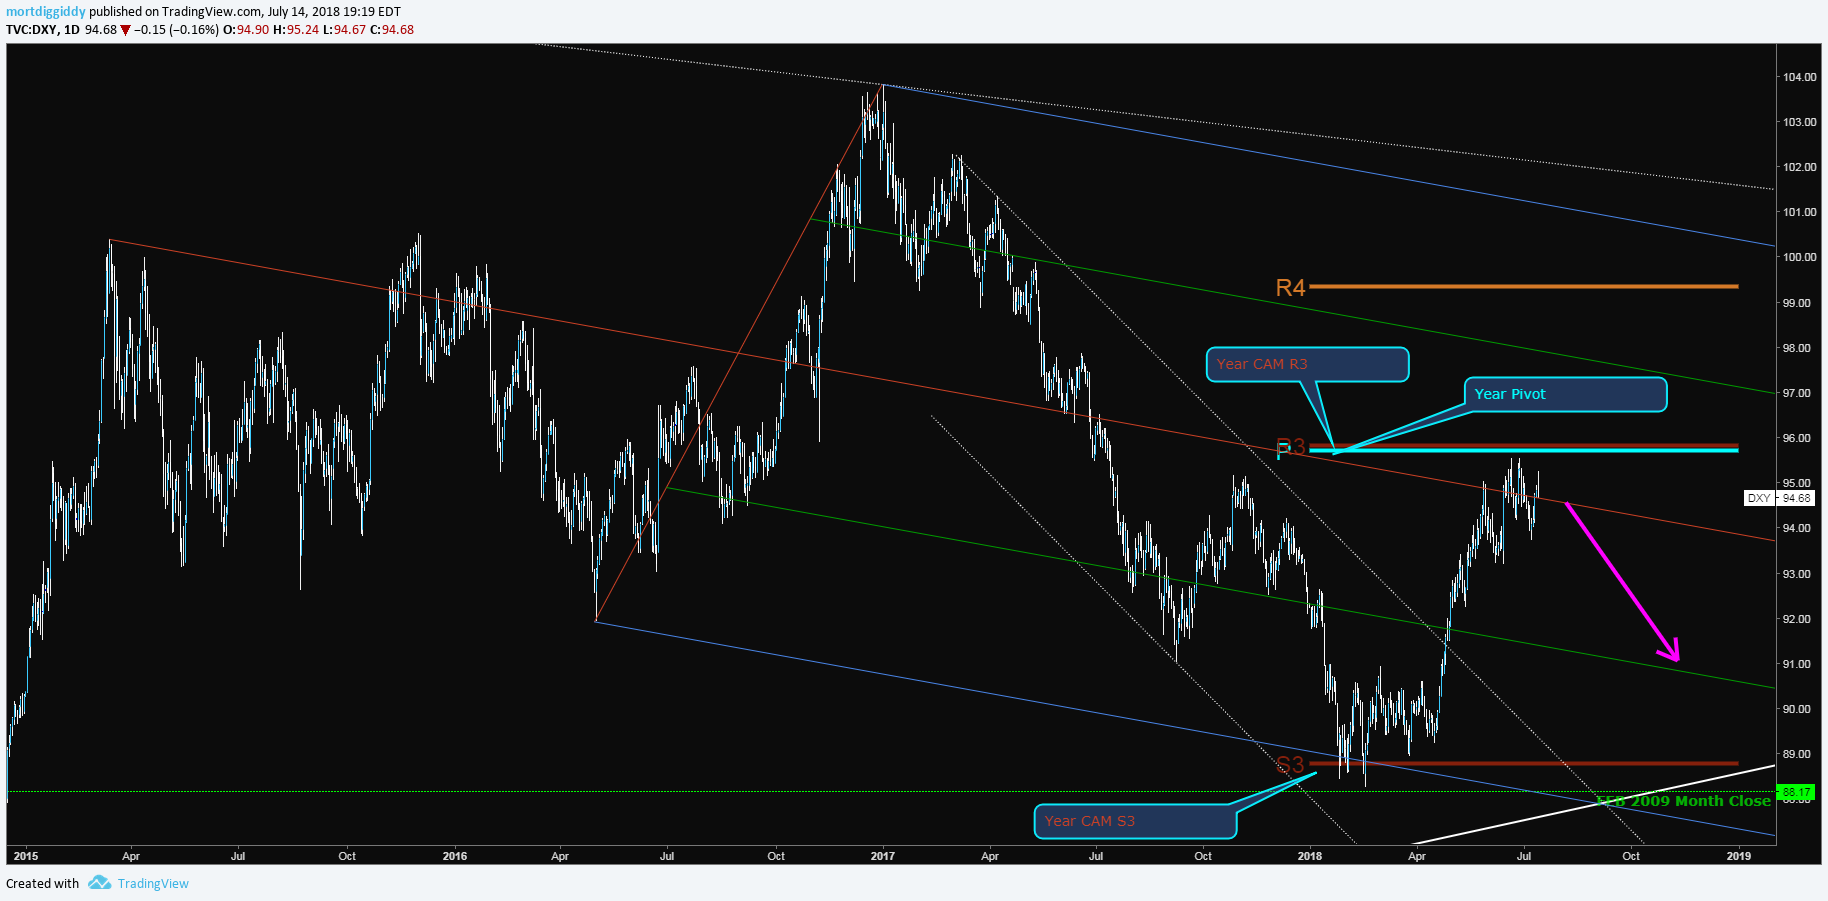
- Top is just under the Year Pivot and Year CAM R3.
- Top is near the midline of major weekly pitchfork guiding the current trend.
- Bottom for the year is near exactly Year CAM S3.
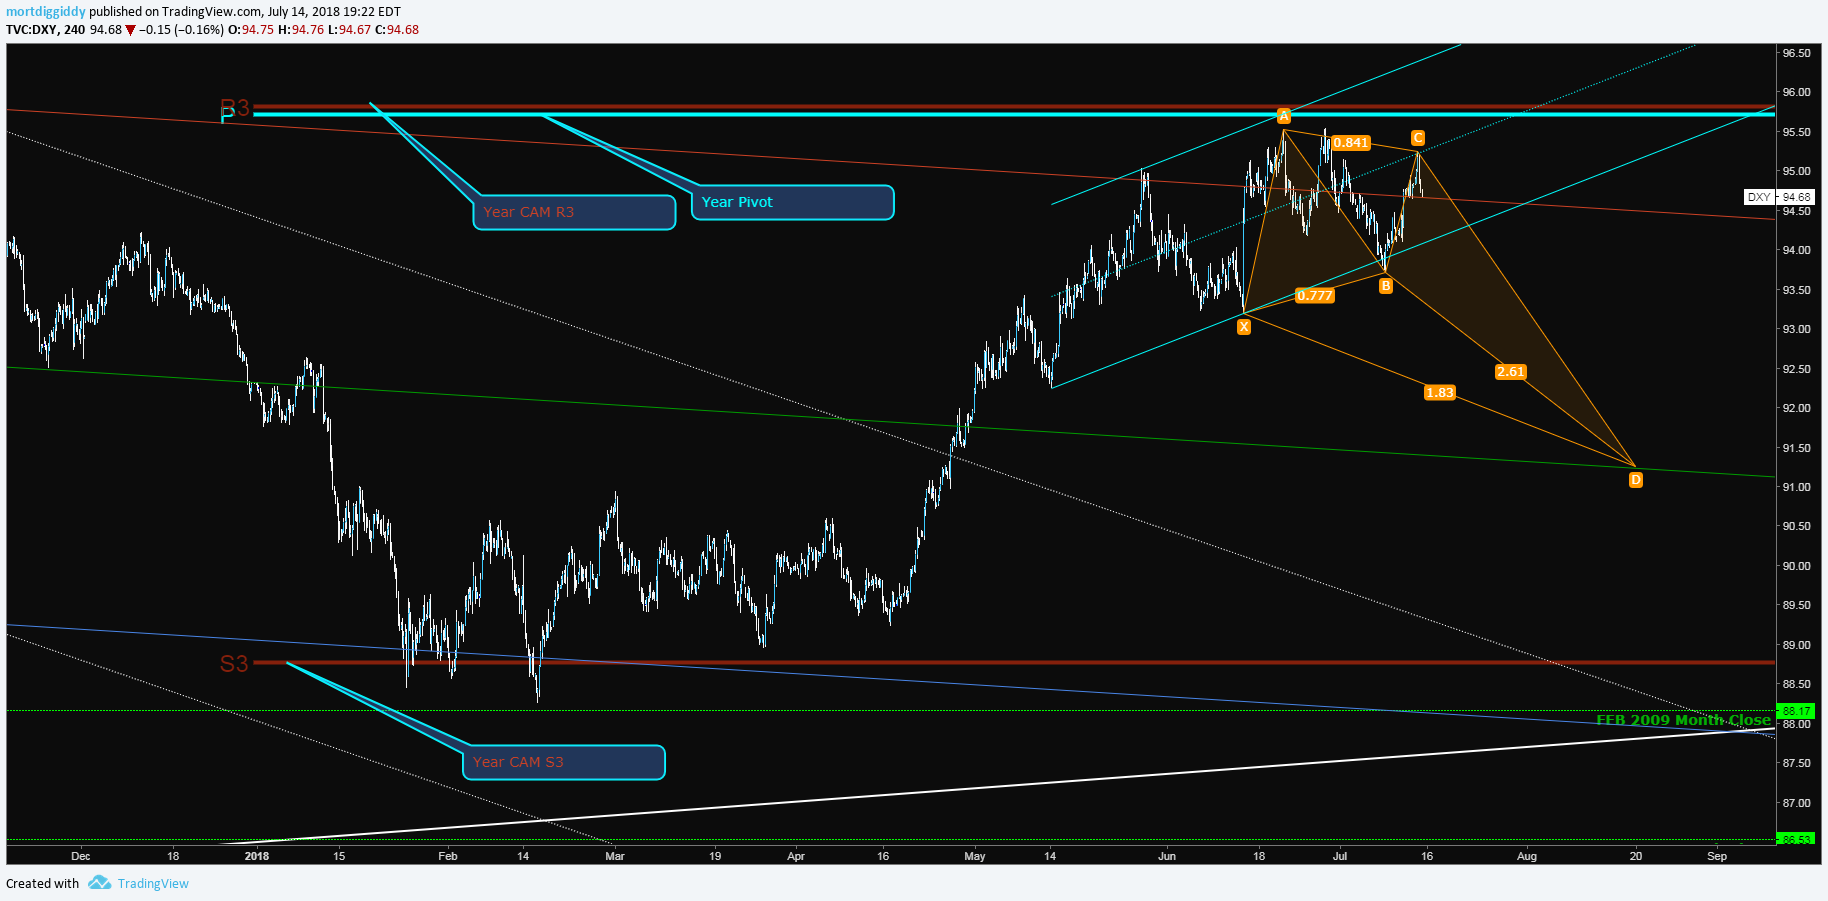
DXY (4HR)
USDCHF (Day)
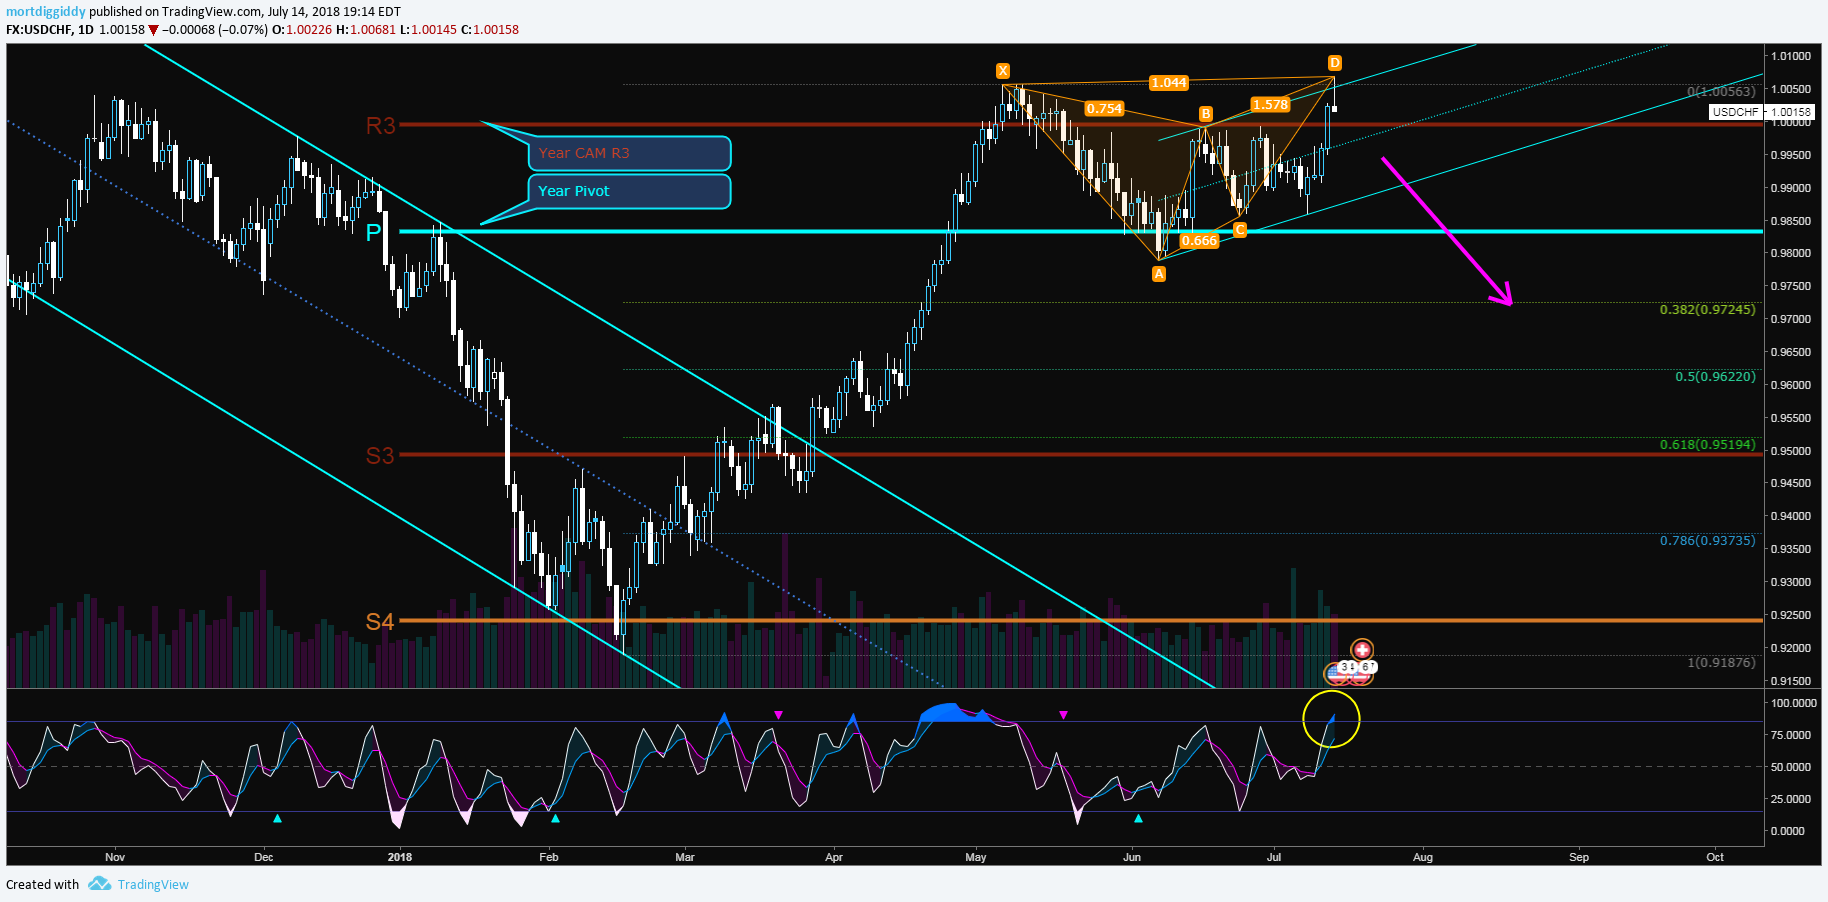
False breakout for USDCHF.
- Bottom of the year was Year CAM S4
- Top is Year CAM R3
EURUSD (Day)
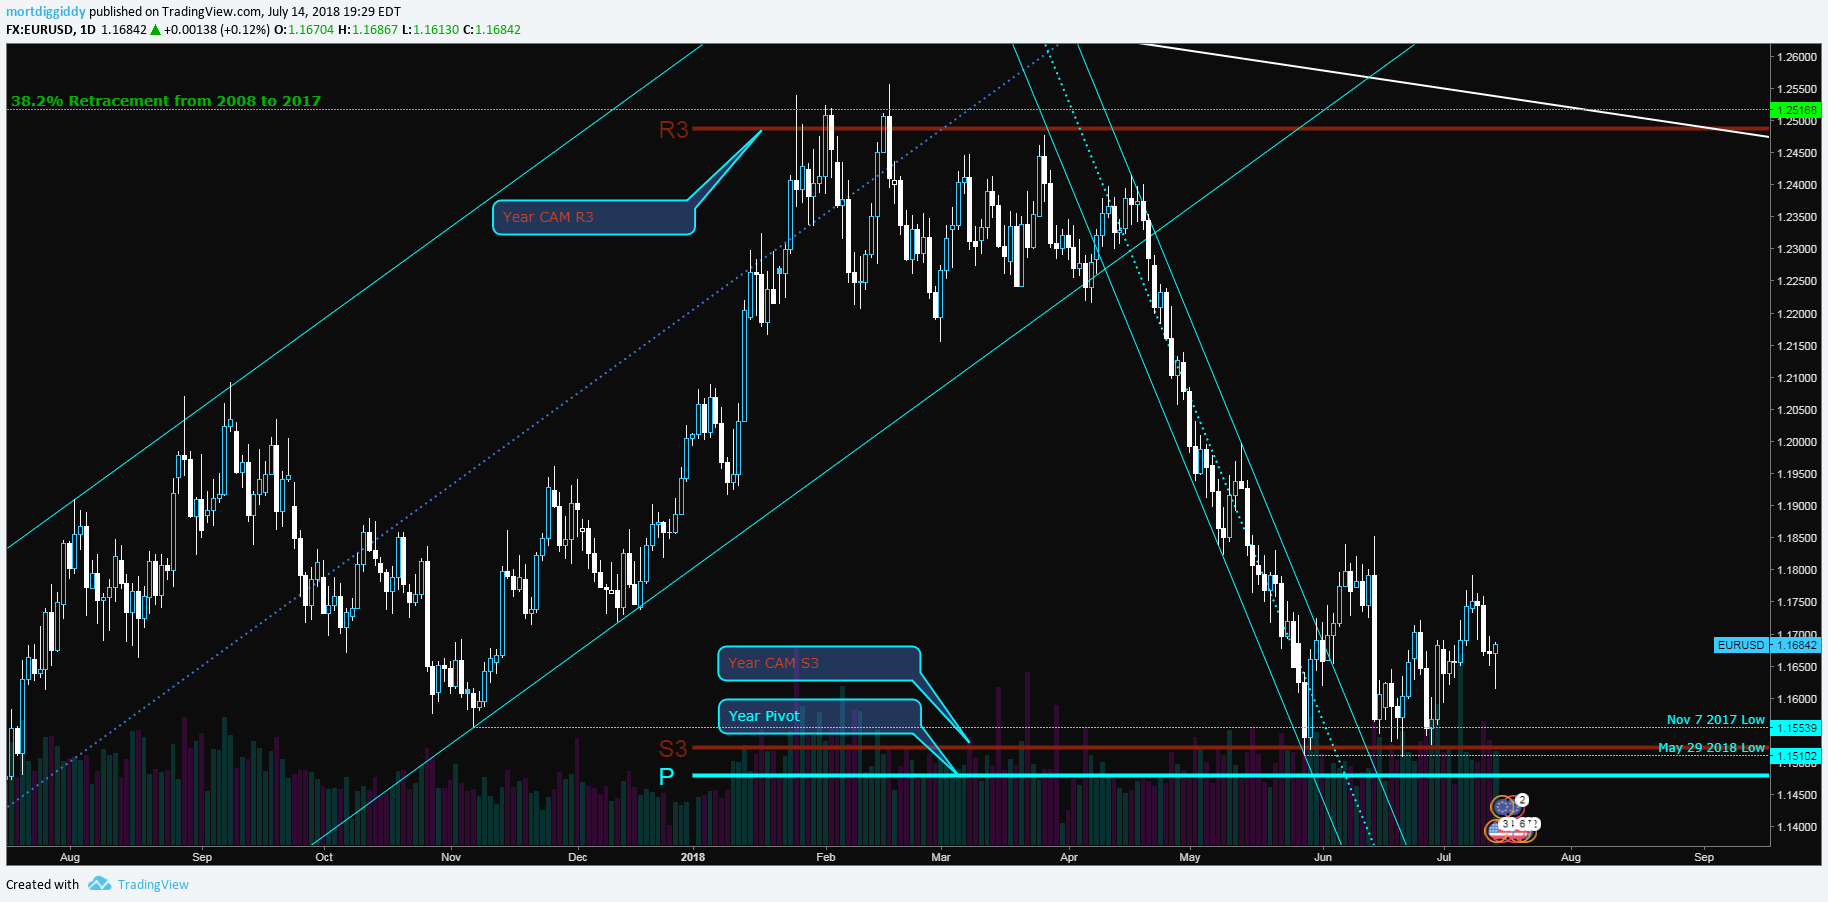
- 2018 Top is Year CAM R3
- 2018 Bottom is Year CAM S3
GBPUSD
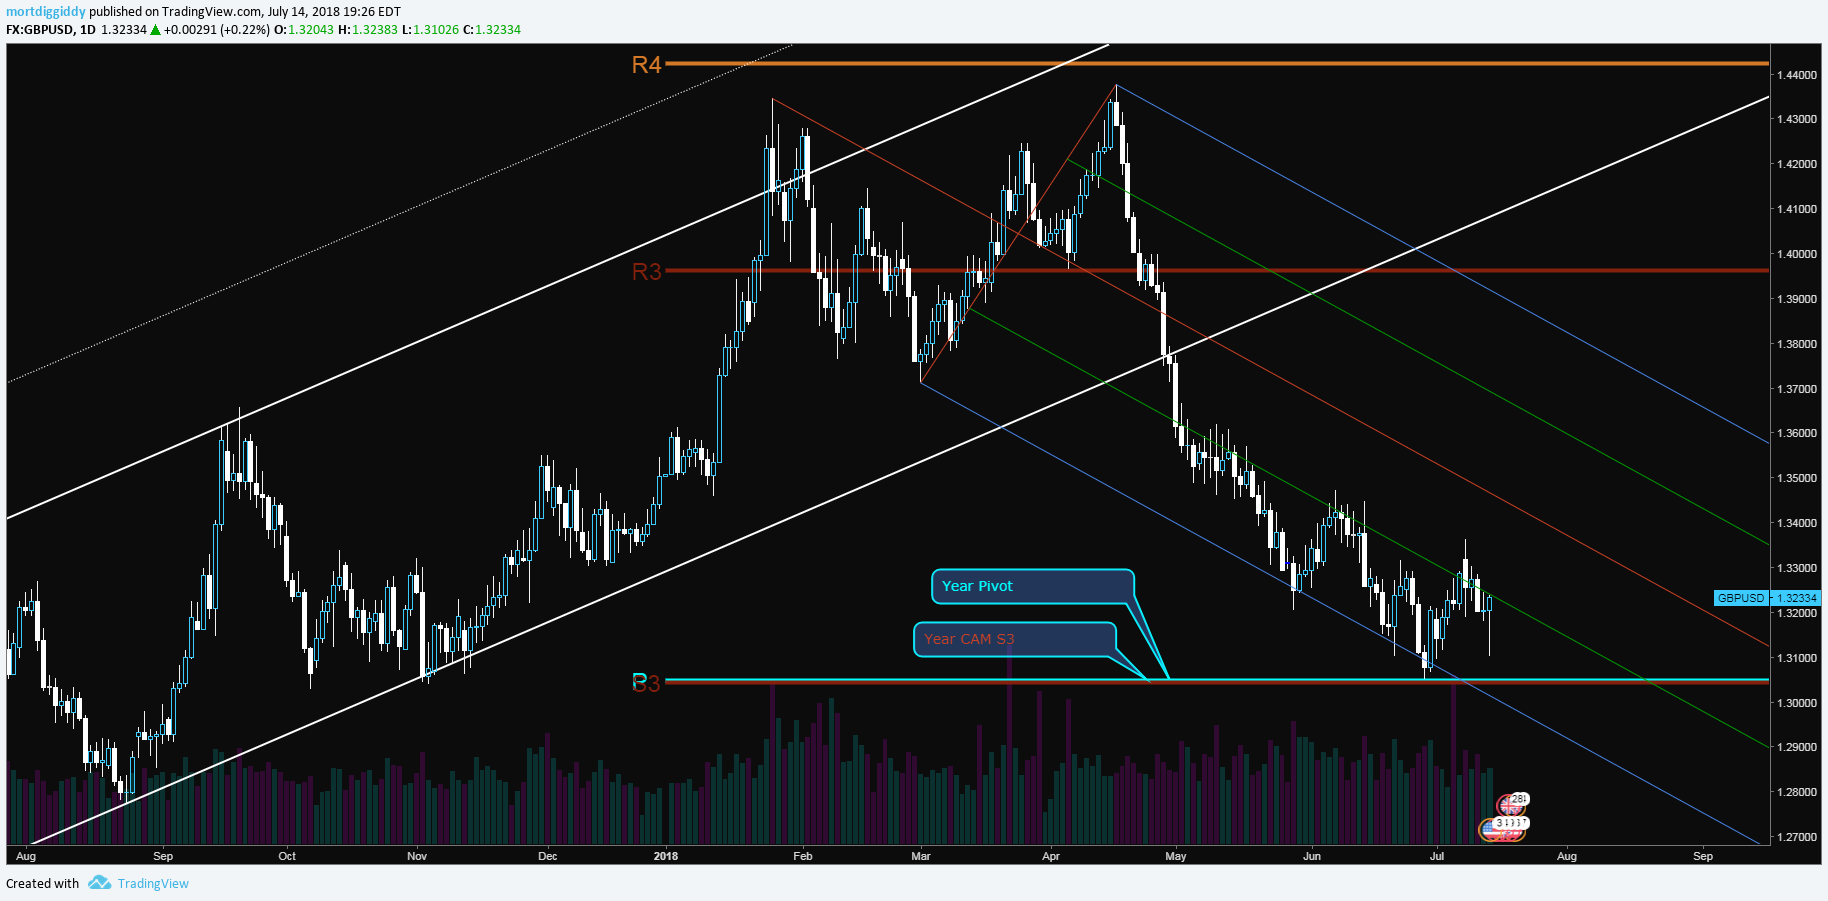
- 2018 Bottom was 2 pips off Year CAM S3 and Year Pivot
- The fact that the Pivot and S3 are so close together makes for huge support
What does all of this mean? I trade Camarilla pivots probably 50% of the time, and the general rule of thumb when you witness a Level 3 to Level 3 movement, whether that be Day, Week, Month, Year Pivots, is that we revert to the previous period close. This would mean that by the end of the year, we revert to the 2017 close for all of these instruments. I can show countless examples of this.
Final thing, we are following the SPX seasonal chart to a T for the month of July:
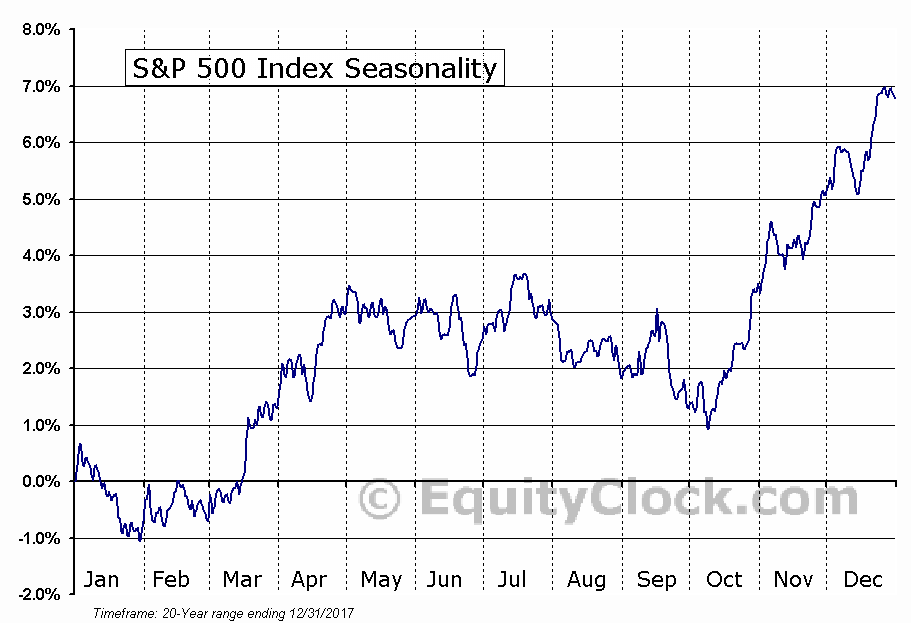
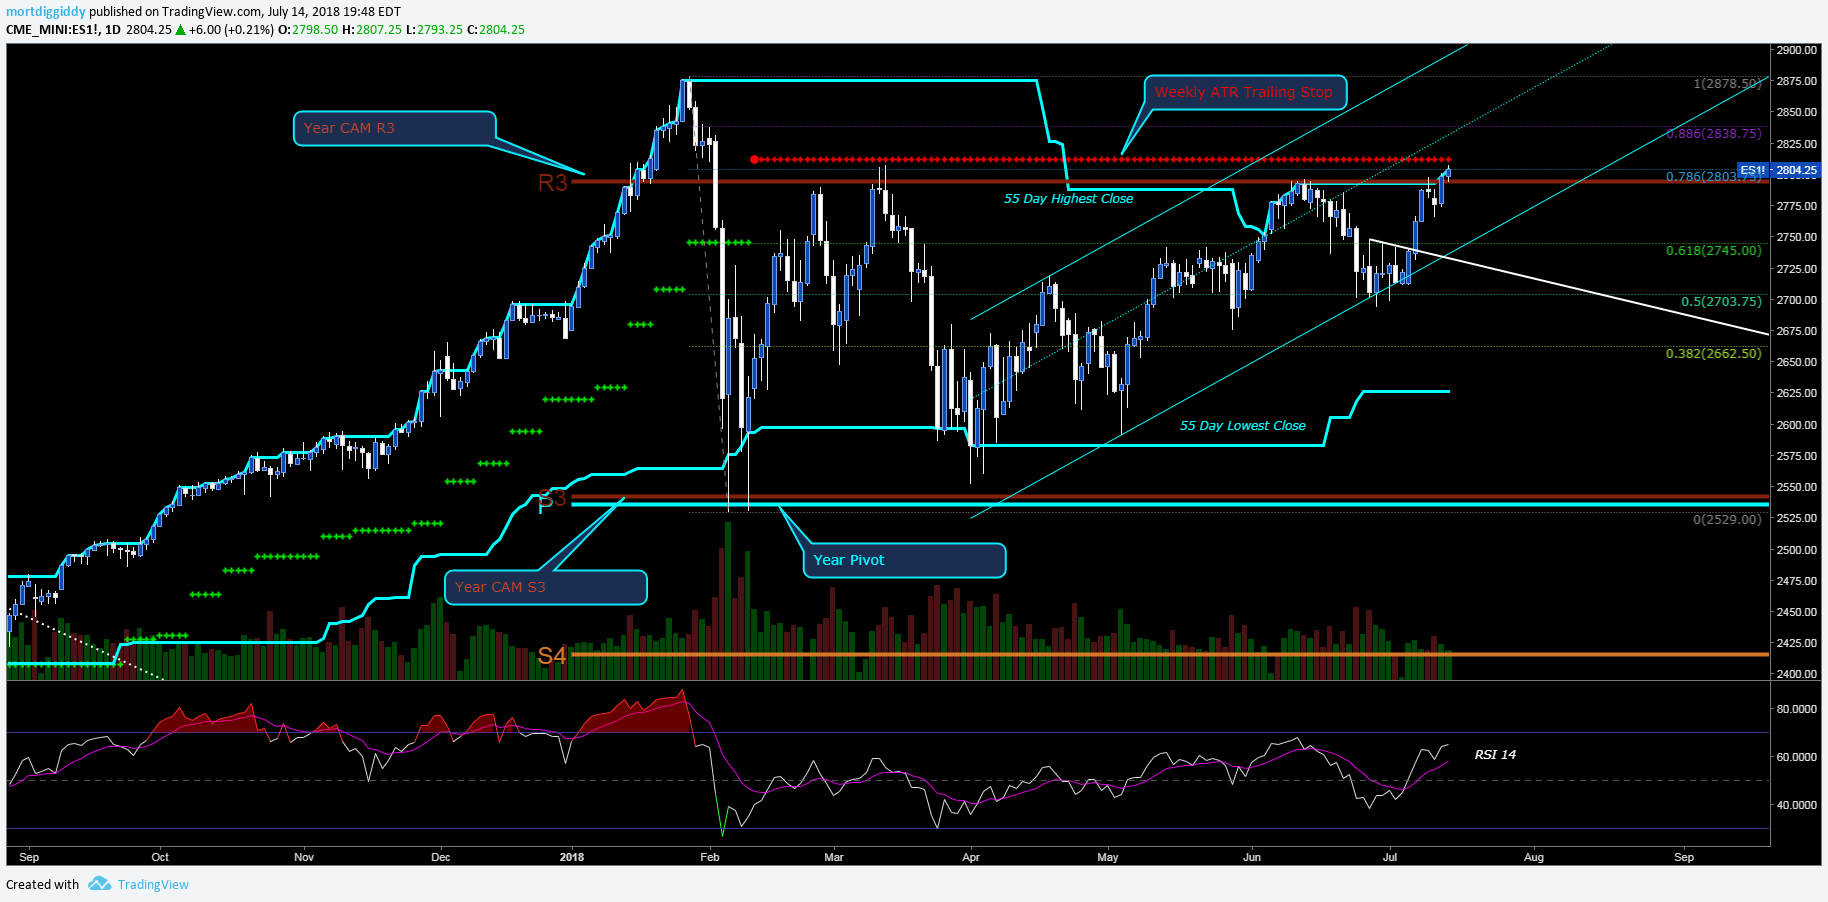
On average DXY tops in July with stocks. I closed my ES futures long positions this week as we just hit the 78.6% Retracement target again, as well as Year CAM R3.
2018 has been a marvelous year of range between these year Camarilla pivots for multiple instruments including metals, currencies, and indices.
SPX500 looks like it is making a perfect Gartley top with an inner zig-zag completed by an impulse wave. As much as I don’t like to listen to the pundits out there calling for danger, it feels like a 1987 style October is coming this year. I suspect that will kick the above chart of SPX futures down to the Year CAM S4 near 2420.00, but that is my personal pipe dream.
unfamiliar with Camarilla pivots – thanks I have a lot to learn
The basics: http://www.futuresmag.com/2012/10/24/trading-stocks-camarilla-pivots
They work best when trading with the “trend” as in all things. Many times the Level 4’s will be powerful reversals, only when the pivot range is “tight” does a breakout happen. When the range is “large” level 3 and level 4 offer great reversals areas.
Thanks Mort
That’s a ton of info well done Sir Diggiddy.
I like Pivots, Sure does feel like the late 80’s…..
What is your thoughts re the PM miners if a Oct 87 re-occurs?
Well it seems that the gold is fairing “okay” based on inflation expectations (CPI) which have been on the rise https://tradingeconomics.com/united-states/inflation-cpi
USDJPY is all but decoupled from gold because of the trade war effects on the Japanese economy. The recent Yen weakness and breakout of USDJPY this week is evident that the correlation that we all loved between the Yen and Gold is disappearing. This really started to show itself with some BoJ decisions late in 2017 when USDJPY tanked and gold didn’t really do anything.
XAUEUR continues to show weakness after a channel breakout and Year R3 top: https://www.tradingview.com/x/fql2Ua5z/
October 1987 shows yields topping around that crash, which is expected, but only for about a year. Two months later gold topped for a LONG time (that high was not broken again until 2005, 18 years later).
1985-1987 was different though I believe as yields were continually on the rise and interest rates were rising off a big bottom around a 1-2 years before, WITH GOLD.
https://www.tradingview.com/x/m3P7n6of/
So basically, I have no idea 🙂
Thanks for sharing this Mort.
Lots to explore and digest
Brilliant work !
Heed hath been taketh.
ditto. never heard of a camarilla pivot.
As for the Yen/gold correlation gone, thought I was the only one considering that. Some yen charts have been posted recently as gold negative and I have been perceiving them more as gold irrelevant. fwiw, I also see “trade war” stamped all over those recent movements.
Thank you for the interesting post.
Forgot to mention that the new rage is to track gold’s movement via the Yuan. Not impressed with that either.
Many, many thanks for this excellent post, Mortdiggiddy. (And for the hyperlinks in your comment!)
The more I learn the more I realize just how little I know.
LOTS of reading ahead for me to understand Camarilla Pivots.