A few key currencies and $GOLD
We have seen these tired old charts before, but there has been some repainting along the trim edge this weekend.
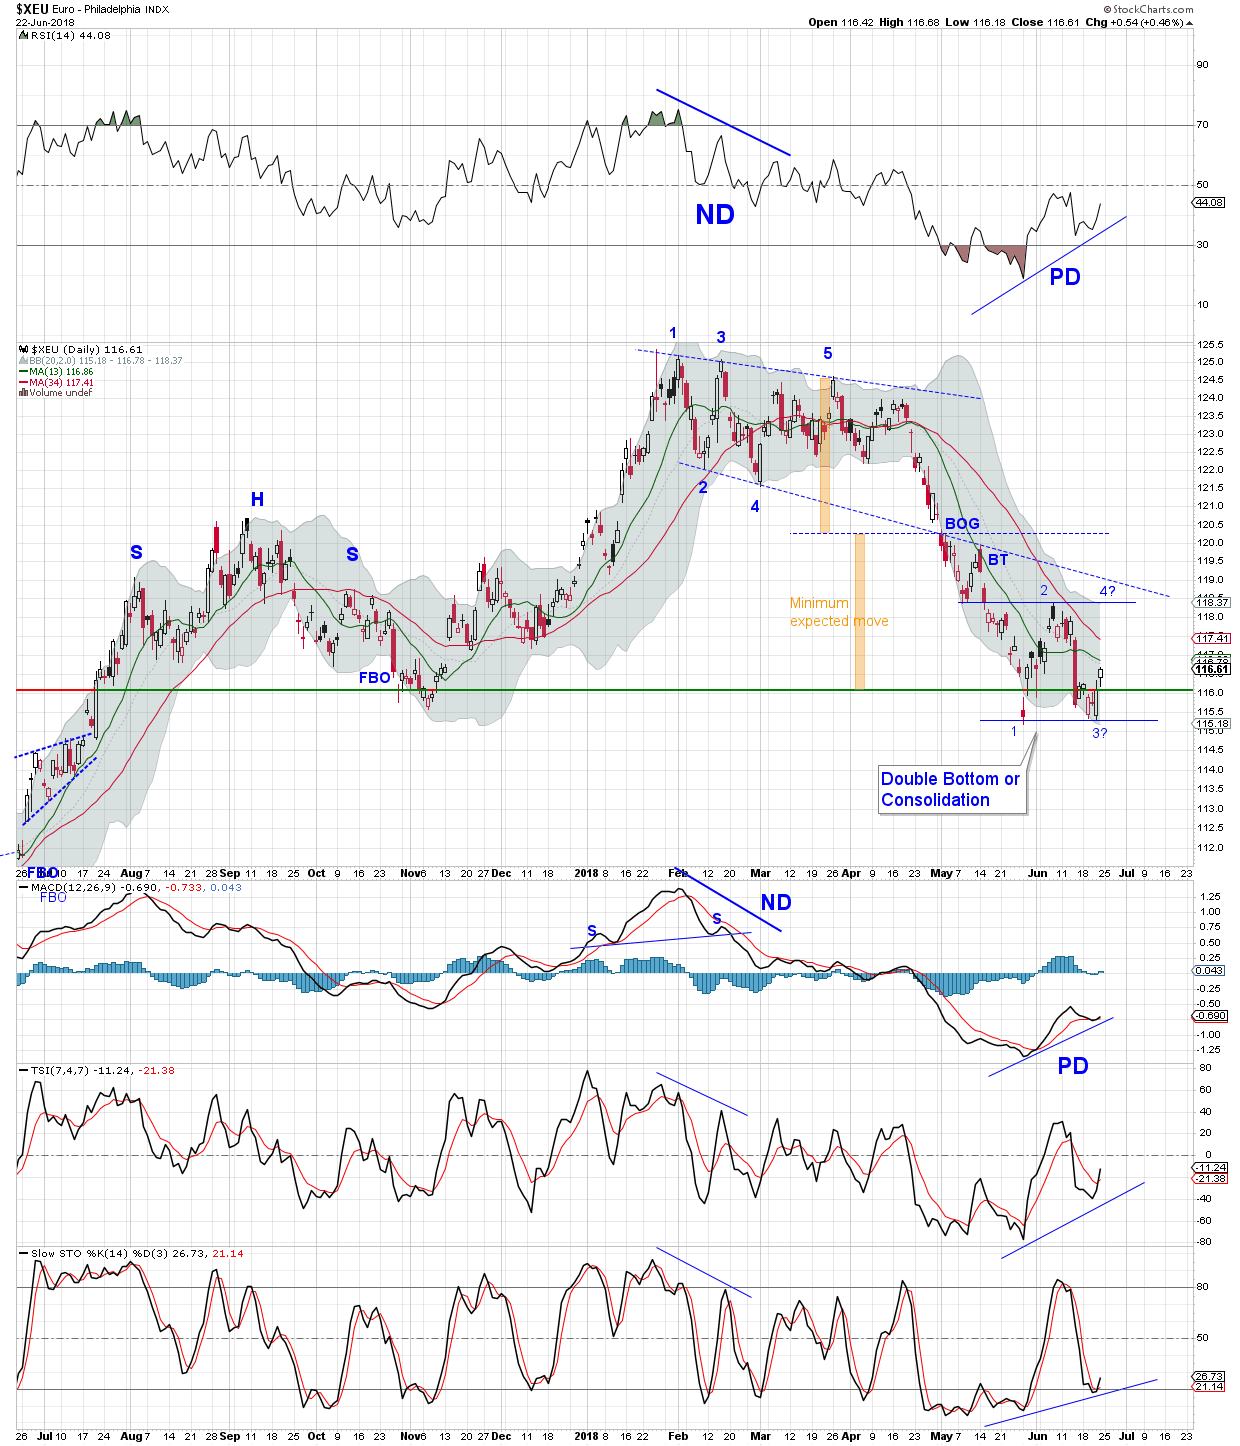
Since $XEU is a lions share of the USD index (52%) we pay attention to where its headed. Right now it appears headed for consolidation. Its consolidating in a down trend, so one might expect the break out to be downside as well. Its possible the consolidation could morph into a reversal. We’ll see.
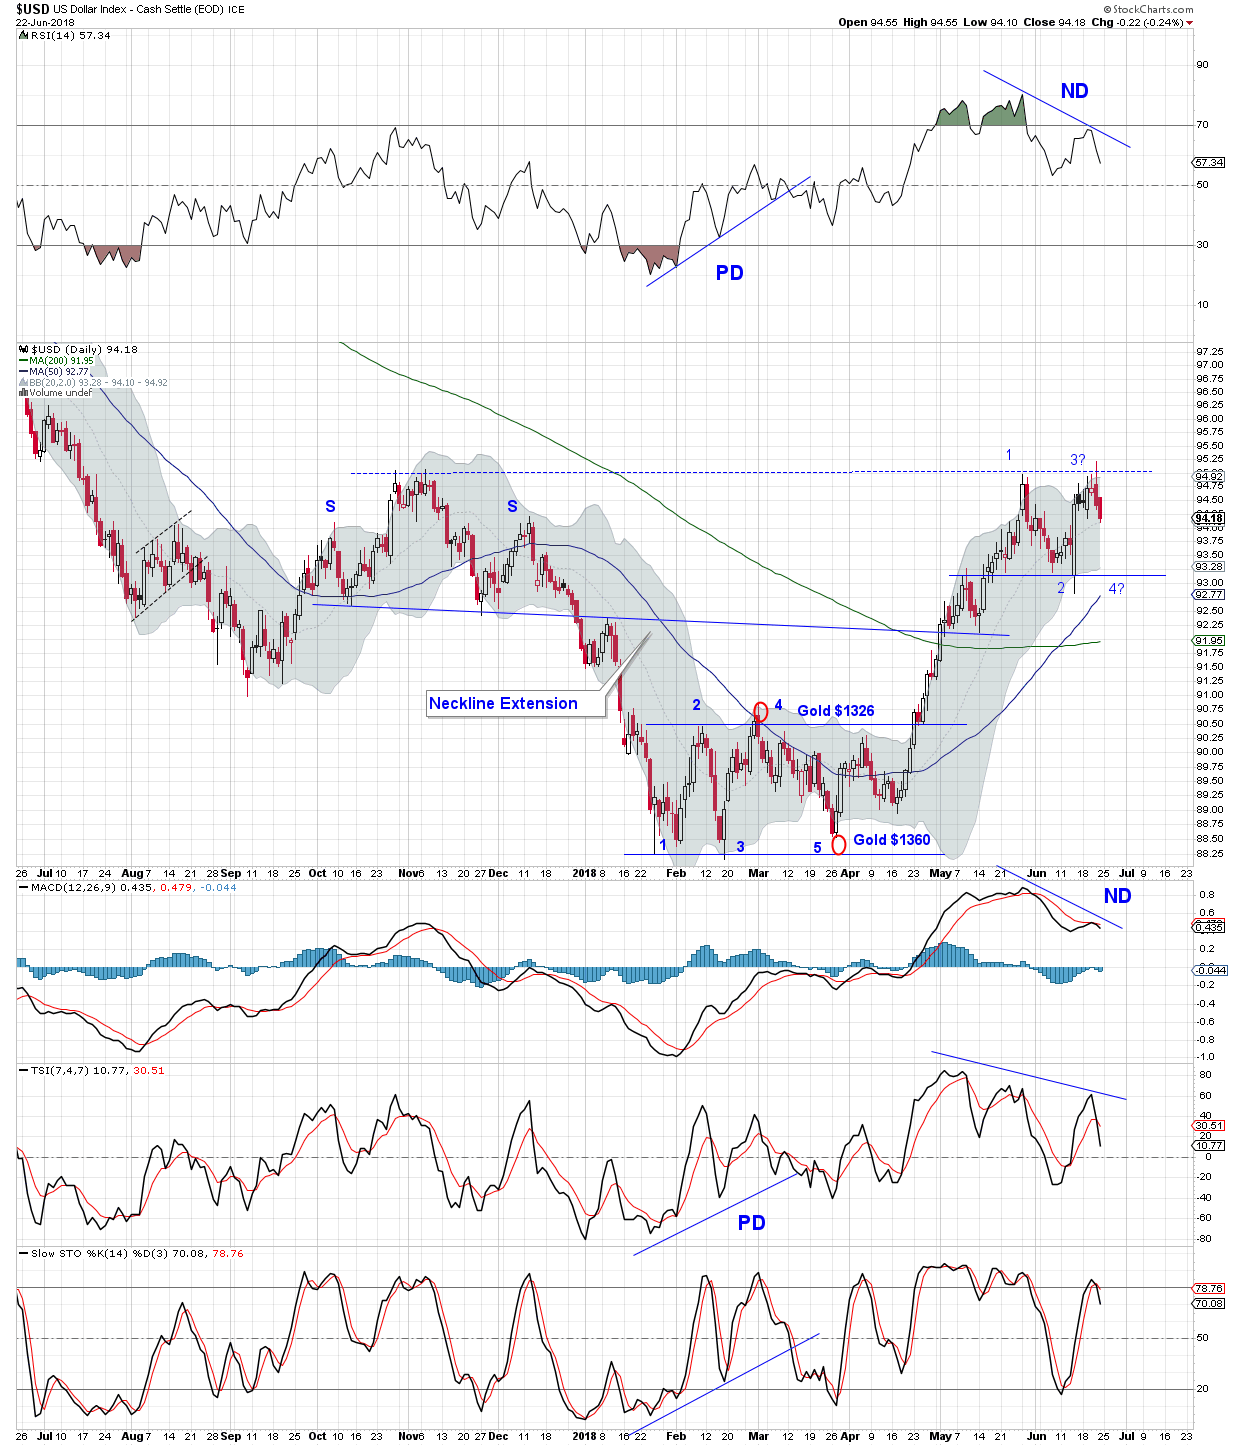
As expected the $USD is also consolidating. Would really like to see a 5 point reversal here. Its possible. A time frame for that to fully develop might be late Summer, early Fall. Again, we’ll see.
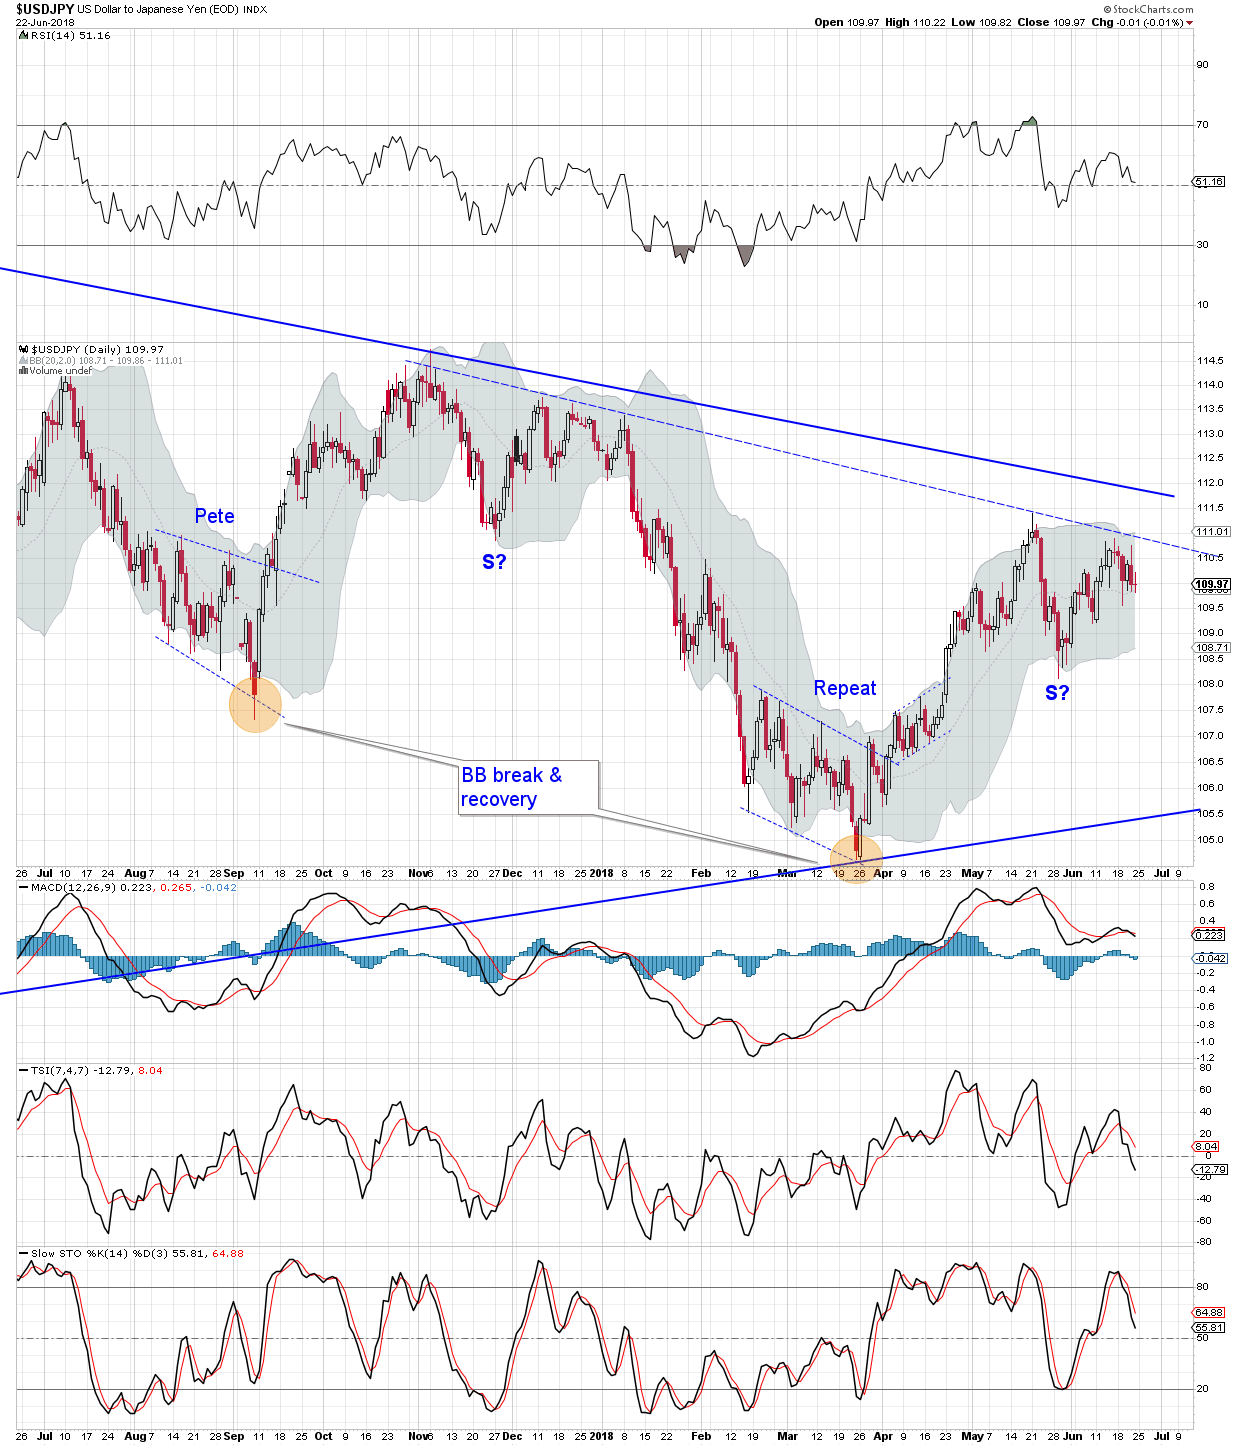
The $USDJPY Bollinger Band breaks on the September and March bottoms initiated similar patterns – Pete and Repeat on the chart. The similarity suggested a rally in $USDJPY, and it didn’t disappoint. For awhile it looked like Repeat could go all the way to the upper solid blue trend line and beyond. So far its just following along the same old path that Pete traced out. If $USDJPY rallies over the neck line of the potential inverse SHS its bearish gold, but if it “peter’s out” that’s bullish…
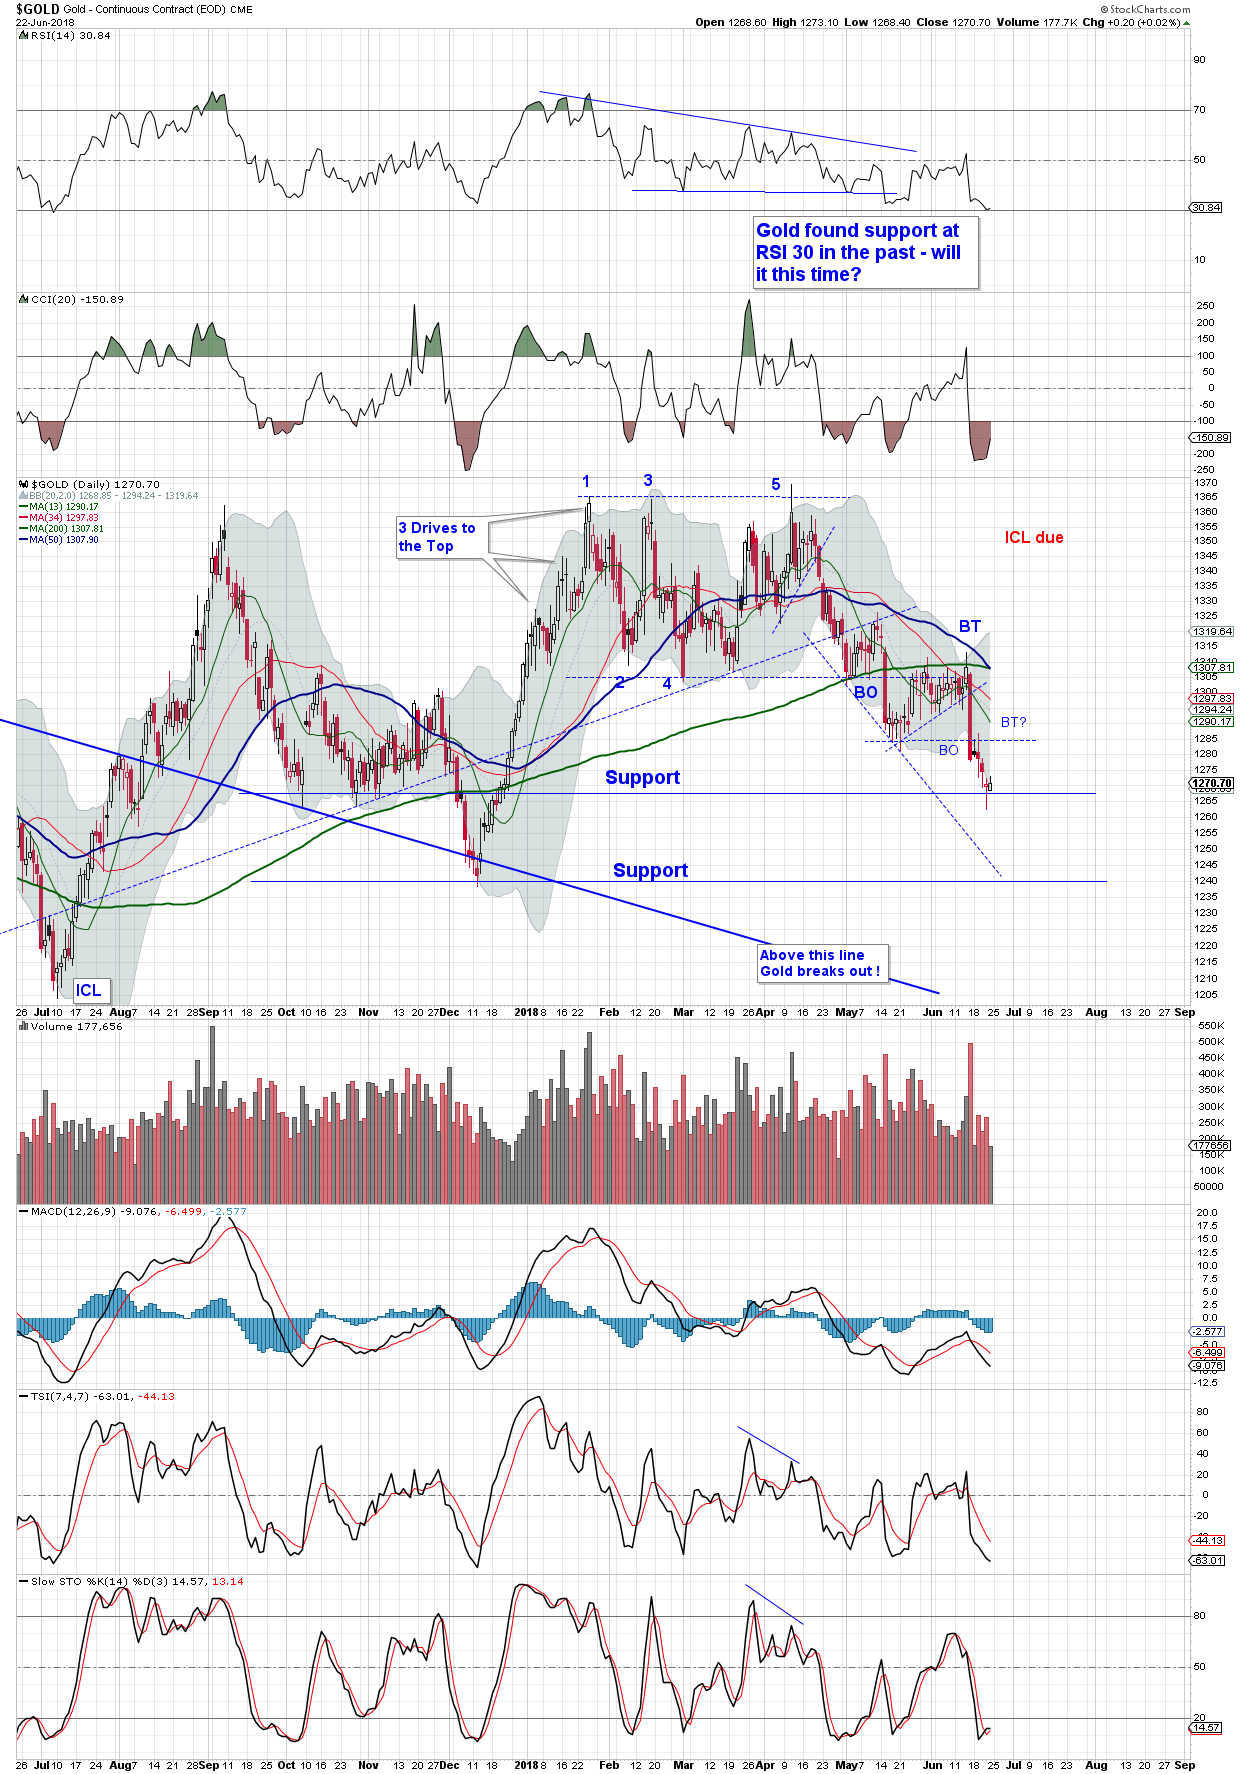
$GOLD daily – This chart looks terrible right now. Huge 5 point reversal. 50/200 DMA bear cross getting underway. Oscillators taking up residence in the cellar. Nevertheless, expecting a bounce here. After that, we’ll see.
For good news that’s like a fresh breeze, have another looks at North’s posts: HGU and First Majestic Silver.
Thanks for the charts, silver fox. Going to be looking at that $USDJPY action as we go forward.
Thanks for the charts SF
I like the Global Perspective. IMO it ain’t a move if a (any) commodity isn’t rising/falling in all currencies not just measured in $US…. the difference between a currency move and a inflationary/deflationary move IMO. But to each there own I guess? I make no decisions just based on $US commodity charts alone.
One should ask themselves how they differentiate between a commodity move and an inflationary move? What if they occur (currency and inflationary/deflationary) at the same time?
IMO the currency ratio charts cannot accurately predict inflation/deflation movements in commodities….just my 0.02?
*Edit “One should ask themselves how they differentiate between a currency move and an inflationary move?”