Gold Getting Critical- Levels To Watch Very Carefully
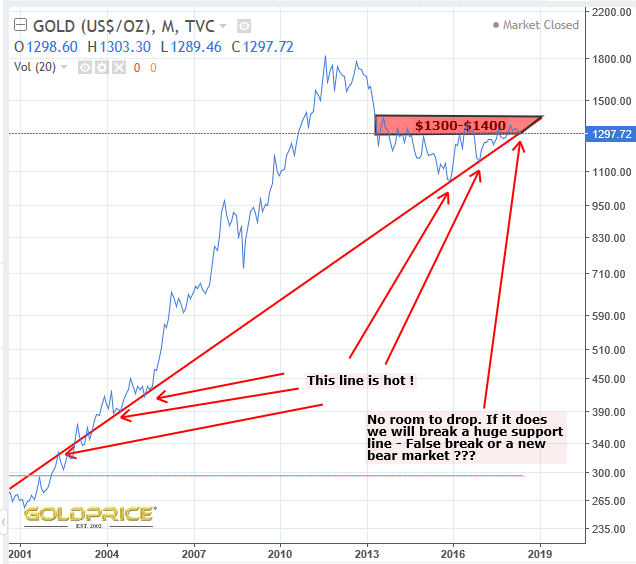
A fairly simple chart, with some (by no means all) support and resistance levels to watch…

The upper two lines on that chart, which I had identified as a possible bull flag some weeks ago, broke to the downside. From a bearish perspective, the recent moves could be interpreted as a backtest, with a large move down ahead.
With the Trump/Kim Jong Un summit and FOMC this week, are we about to get a catalyst ? The chart below is fast becoming my most important chart to watch. I know that cycle analysis might support a final plunge before we take off, but that would require a break the very hot, long term support line. Maybe we need a false breakdown, to shake out the market and destroy sentiment (which is already very low). When such a hot support line comes up to meet a huge area of overhead resistance, gold (in my view), isn’t destined to carry on grinding sideways. I expect one of 2 outcomes no later than Jan/Feb 2019. Gold will either be held below resistance, fall through the support it’s currently sitting on, and sink to the bottom of the ocean (sub-$1000), or it’ll burst upwards like the proverbial ‘beachball held under water’ confirming (at last), that we really are in a new PM bull cycle.
Sentiment pretty low. Gold hated. For me I’m having thoughts I’ll never buy gold ever again. As I sit on my positions
We’re all waiting for FOMC
Meanwhile. Tariff issues escalating.
G7 blows up
China steals secrets
Meeting Korea
If one of these does t nice gold. Seems we’ll need a nuclear war to move gold which of course we don’t want.
The charts are saying a move is coming Mserr (in my humble opinion).
I see that. And Thank you for sharing your work
Northstar if you plot your second chart on a 1:1 scale (not log) then gold can fall substantially before hitting the “hot” trend line.
As you are familiar with how you have drawn that trend line could you post that chart on a 1:1 scale and we can check exactly the potential fall.
Thanks.
Hi Norvast. Exactly right and I meant to do it yesterday. I’ll do it as soon as I have time.
And if you guys have the inclination, could you tell us why in this case you think 1:1 vs. log is a better representation of the situation. Thank you.
Hi CT. Both log and non log are fine. The main point to note is that a log chart is more appropriate if the price scale is increasing by orders of magnitude (tens of dollars to hendreds to thousands). That tends to be the case on much longer timeframes. However, if you’re looking at shorter timescales a log scale just isn’t necessary.