Samuel Benner
Posts have been a bit slow lately, so I thought I would do one on Samuel Benner. He was an early cycle theorist (late 1800’s) and farmer that came up with a timing chart for business and commodity cycles. His original work was picked up later by AJ Frost who enhanced it to work with the US Stock market in the 1970’s. Frost’s chart only showed predictions up through the 1980’s, but gave the formula to continue the pattern. I have taken the liberty of extending his chart using that pattern and here it is:

The bold numbers are my extensions based on his pattern, and the red numbers are actual years for highs and lows. As you can see, 2018 is predicted to be a significant high which will be followed three years later by a low. This is the same high-low pattern that was predicted for the year 2000 (high) and 2003 (low).
How has this worked in the past? Here is a graph I made to check:
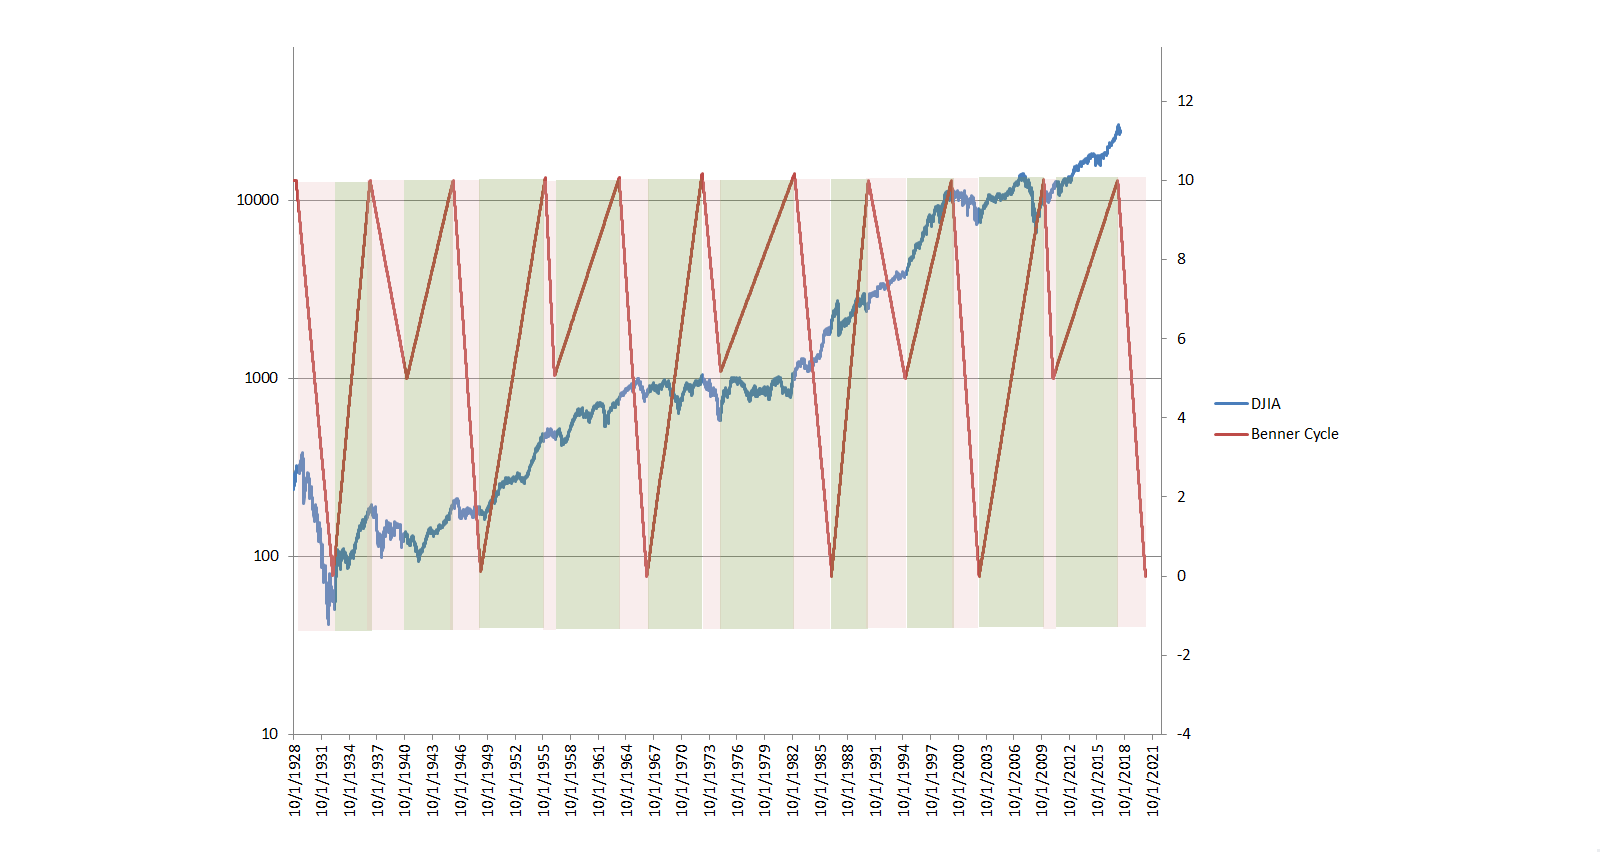
Not perfect, but worth paying attention to. Anyway, for those of you who would like to dig a little deeper, here is the website I got the original chart from:
Samuel Benner’s Cycle Theory
Thanks KenS
A fresh perspective is welcomed at this point
Will have to study this a bit
Thanks Ken