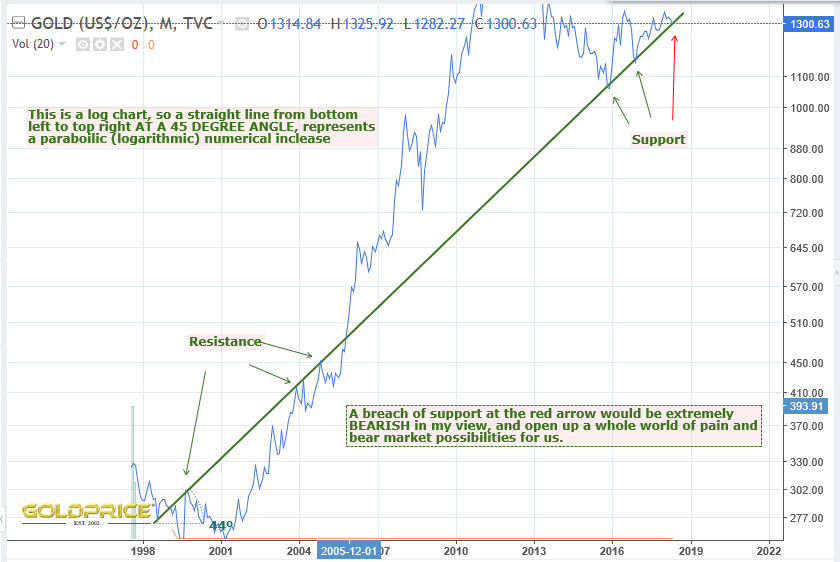
Line In The Sand
When viewed on a log scale, a parabolic trend is shown by a straight line rising from bottom left to top right at 45 degrees. The current price action has left us resting right on that line (the best fit on this charting software shows 44 degrees, but that’s close enough for me). This has to be a hugely important line in the sand. The red arrow shows us resting right on the parabolic uptrend line. The importance of this line is clearly shown by the way it’s acted as resistance and then support over many years. There’s very little room for manoeuvre here, and a clear break below could spell some serious trouble. I’m bullish at this point by the way, but you have to look at all possibilities.
Interesting, original, and important chart, IMO. Thanks Northstar.
🙂