Some USD charts and EW forecasts
From observing the US$ decline in previous periods (2002-2004), there are parallels with current period. From high to first interim bottom, the US$ declined 16 points in 2002 and afterwards rebounded with 6 points. (see April 2002, from +/-120 to +/-104 and rebound to +/-110)
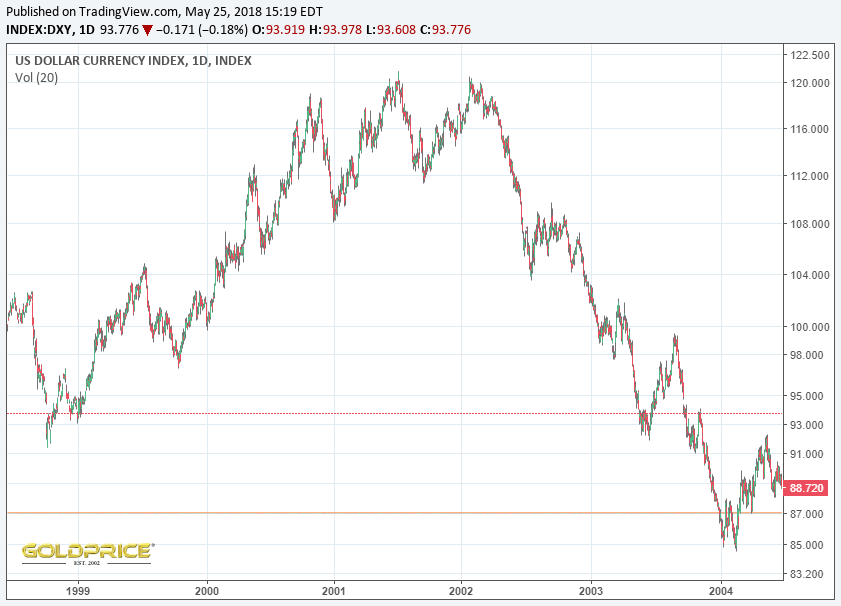
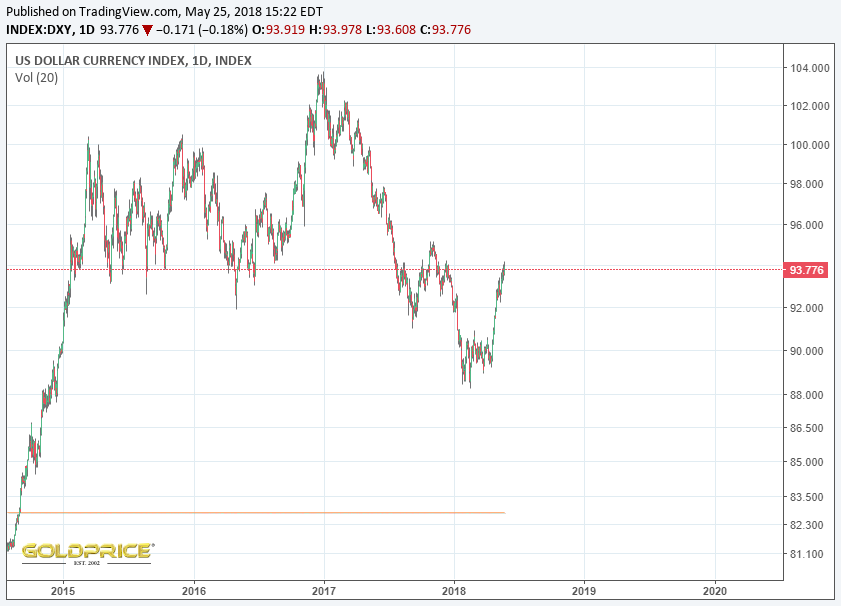
Right now it seems we are in the same situation: decline with 16 points from +/-104 to +/-88 and rebound to +/-94, around current level. So it is very much possible we are nearing the end of this $ bear market rally and PM weakness
Apparently Avi has the same target for a possible top in US$:
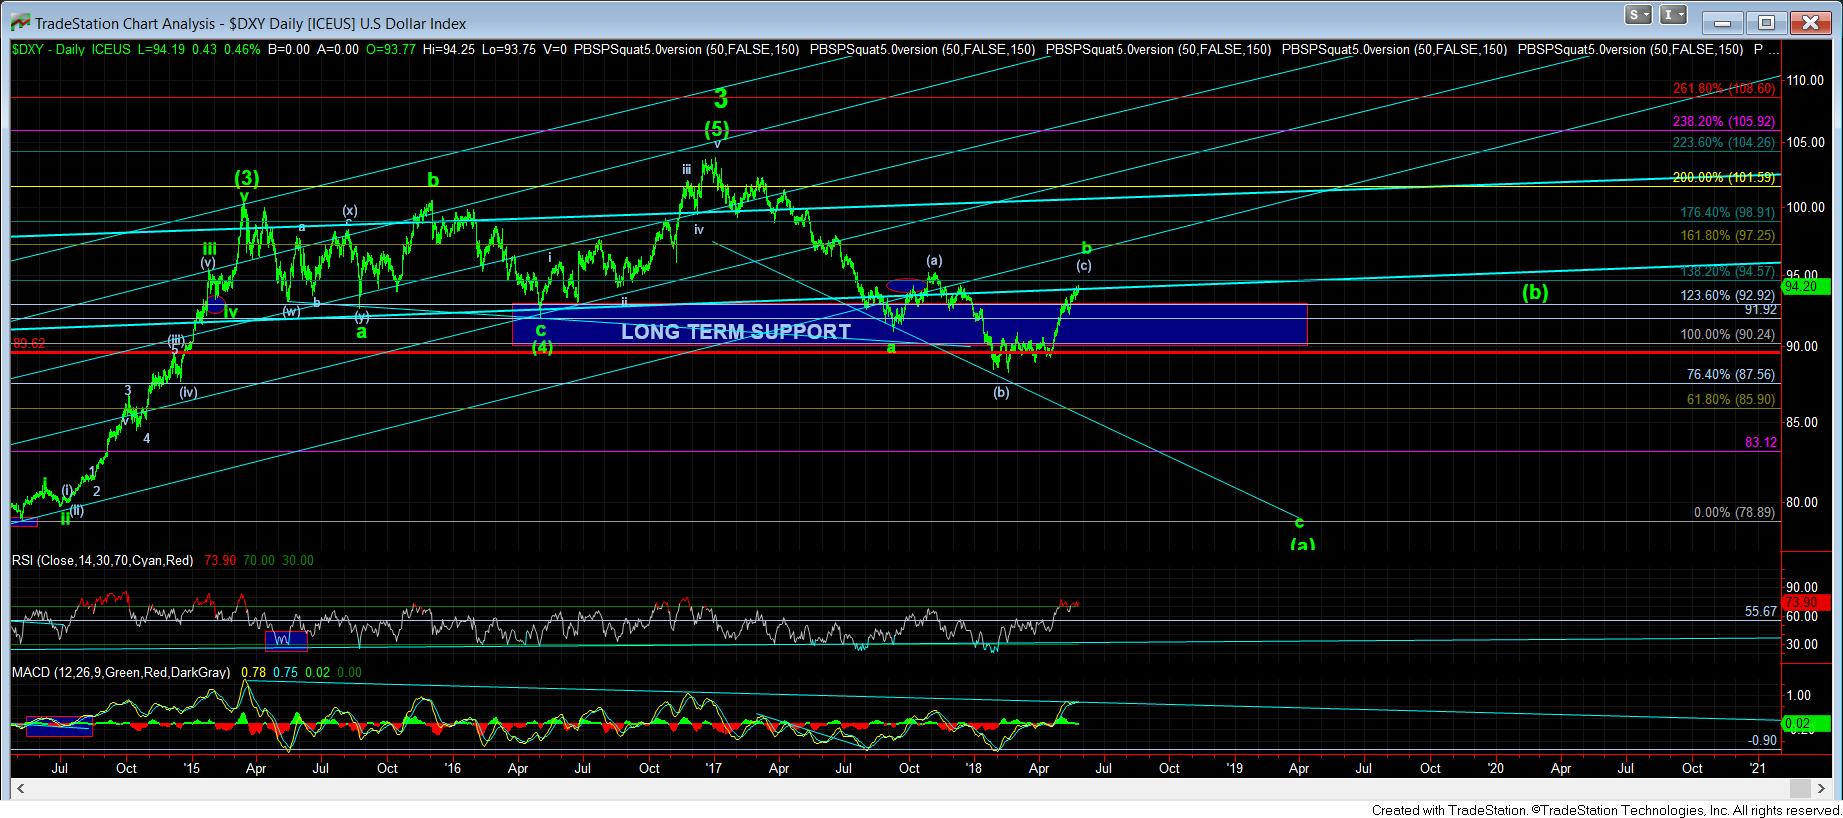
If his thesis is right, it will be time to sell all PM’s again by Mid 2019, so I doubt share prices will be that higher by then. It could take more time for a true bull market in PM shares, maybe in 2020 after his next forecasted bear market rally from 80 to 95 level?
I do however not agree with AVI his EW chart as previous bear markets in the US$ always lasted 34-36 months as previous shown on this forum so bear market in US$ should last till end of 2019 and the bear market rallies were never stronger than 6-7 points! If history is any guide we should go down 12-13 points next decline towards the 80-82 level.
I have not found Avi’s market analysis to be financially productive.