$XAU-Gold Ratio Charts
Various points:
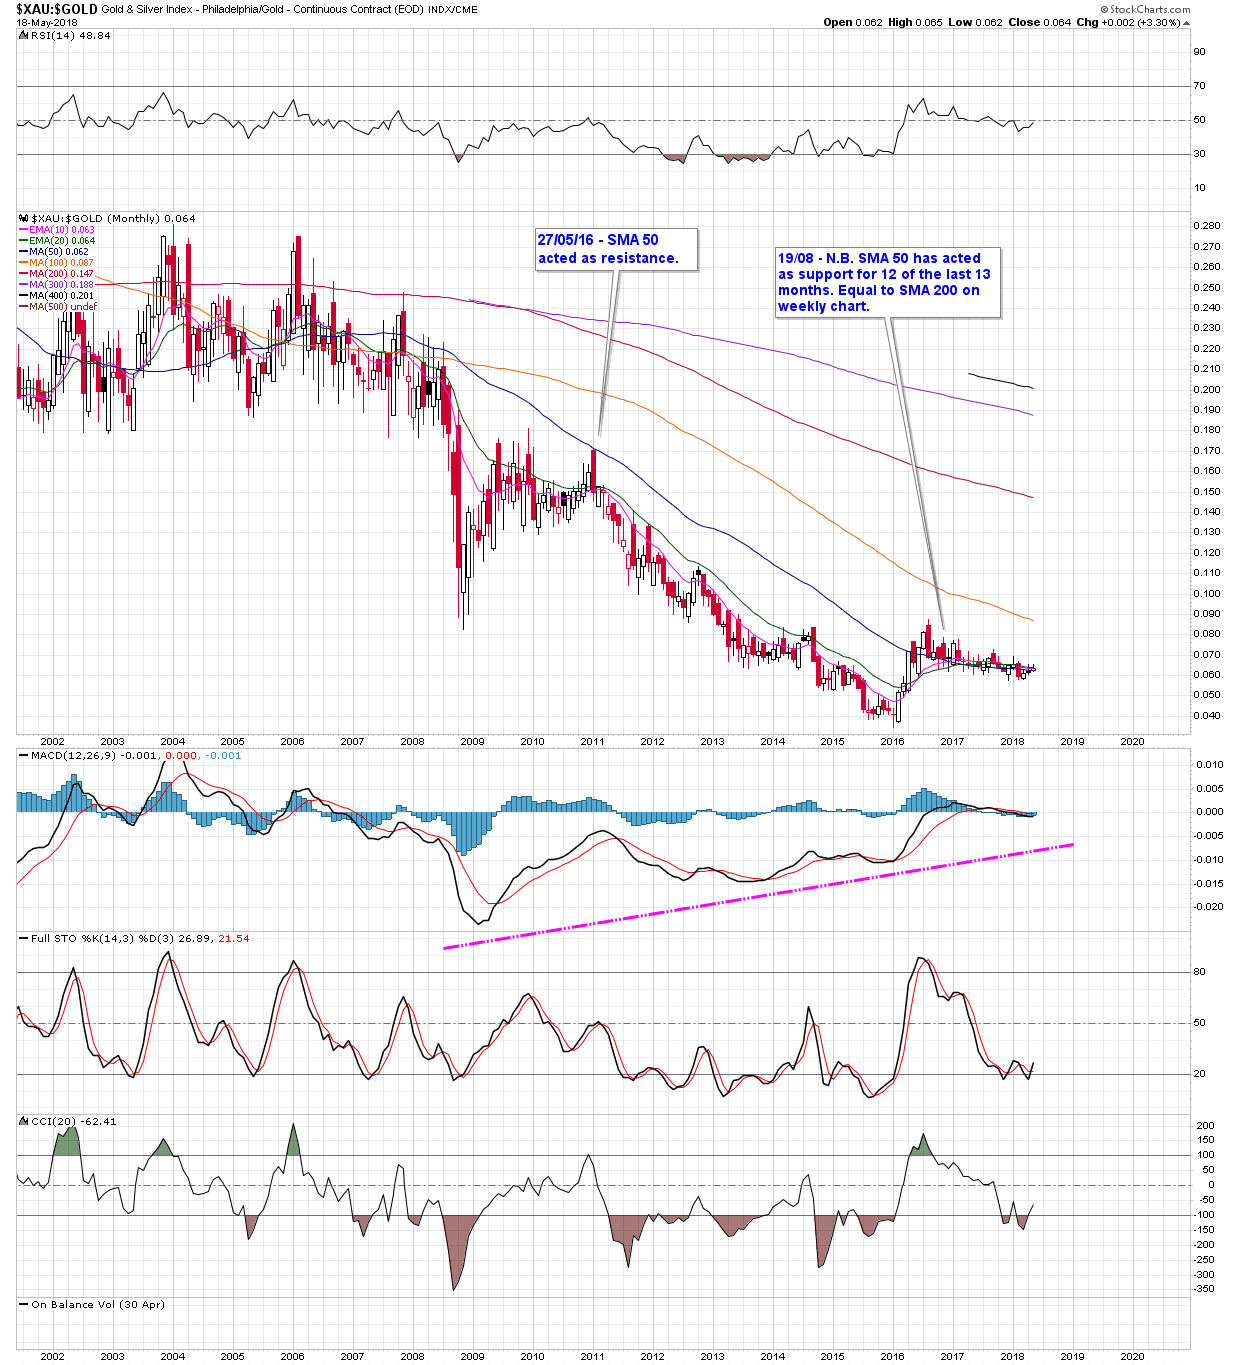
Chart 1 – Price broke above the SMA 50 in mid-2016 and, since then, it has been pretty much sitting on top of it with very little
movement up or down. As you can see from the chart, this lack of volatility hasn’t happened since at least 2002. Prior to mid-2016,
price had been clearly below the SMA 50 since 2008. Also note MACD. It is gradually clawing it’s way back up from highly negative.
Once MACD turns positive again, which it isn’t far from doing, we should get another decent rally.
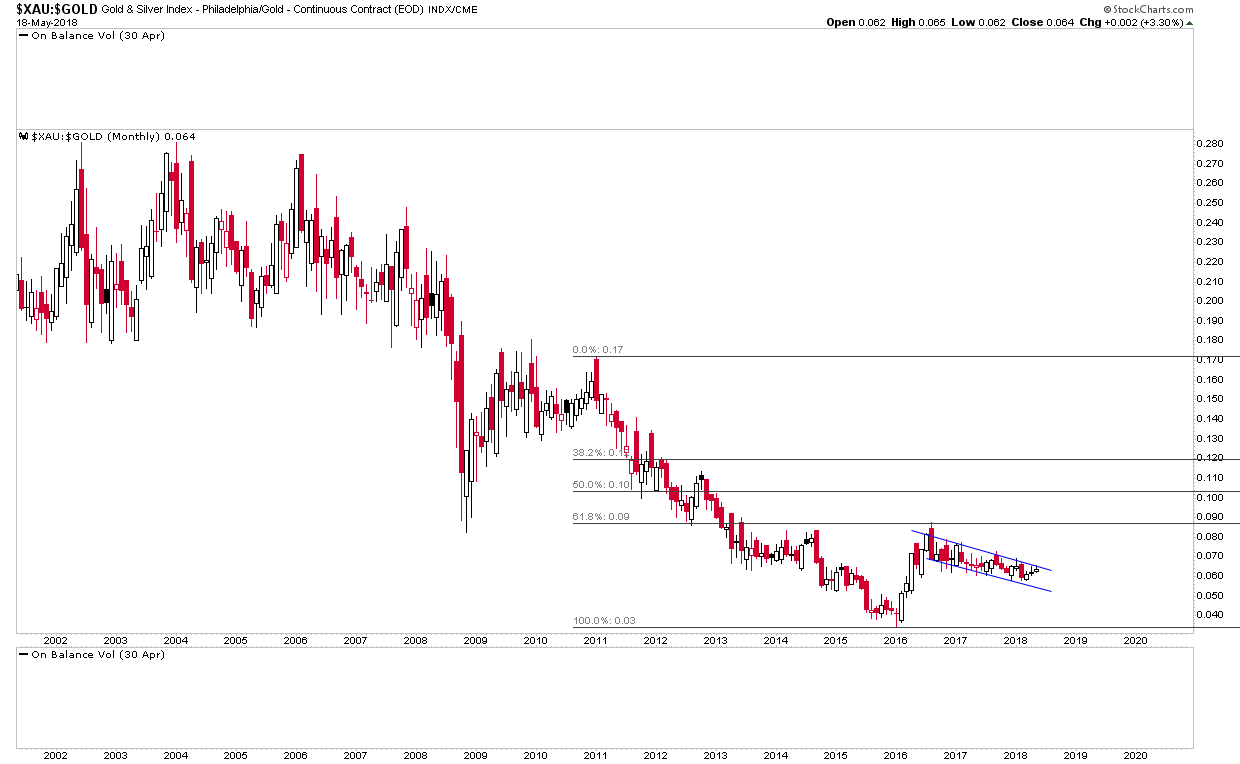
Chart 2 – To me, this is a quite obvious bull flag. It’s one that has been building out for the last 24 months but a bull flag
nevertheless. I also expect this pattern to turn out, at least, to be a halfway pattern to the upside.
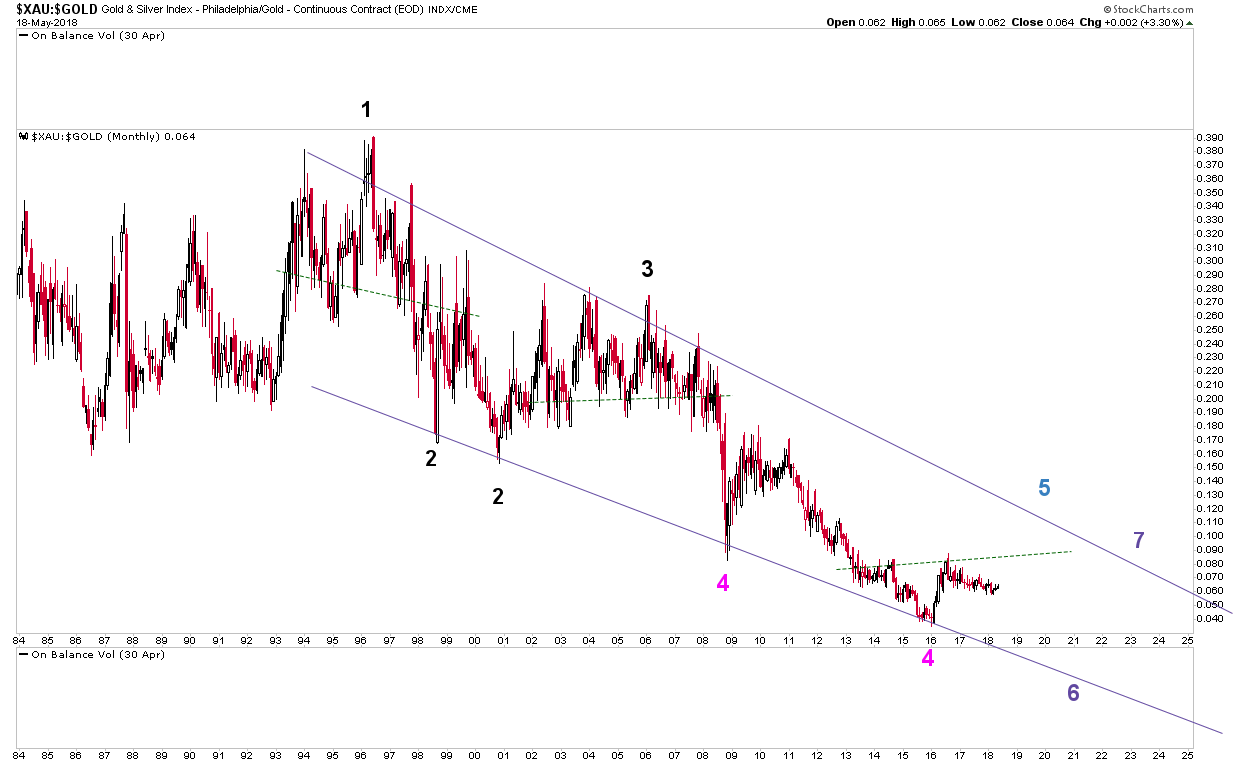
Chart 3 – I prefer to look at the $XAU-Gold ratio chart rather than HUI-Gold because the data goes further back.
(Incidentally, it was you Fully who first posted this chart.) This chart says to me that the large cap gold miners have been
in a bear market in relation to gold since 1996, 22 years ago now. I also think this pattern will, ultimately, turn out to be a
bullish falling wedge. As of now, my game plan over the coming 24 months is the miners fall further in the next couple of months,
monster rally up to point 5, gruesome collapse back down to point 6 (GFC 2.0 – repeat of price action of 08/09), then rally back
up to point 7 and break out. Once price has clearly broken above the top rail, I would expect price to rally back up to the previous
high of 0.390, probably in a lot fewer years than it took for price to fall from 0.390 to the low.
After that, I don’t know.
Great work JL. Ties in with my general expectations. I suspected gold to the $1280 region may be ‘necessary’ but was thinking more of a short spike down. There are now more bearish scenarios coming into play, with lower targets. Nevertheless, I do believe we will move to the $1450-$1550 region before a nasty move down (your point 6 in chart 3). The final move from that low towards the final top in 2026 should be exciting.