$USDJPY – Daily, Weekly, Monthly
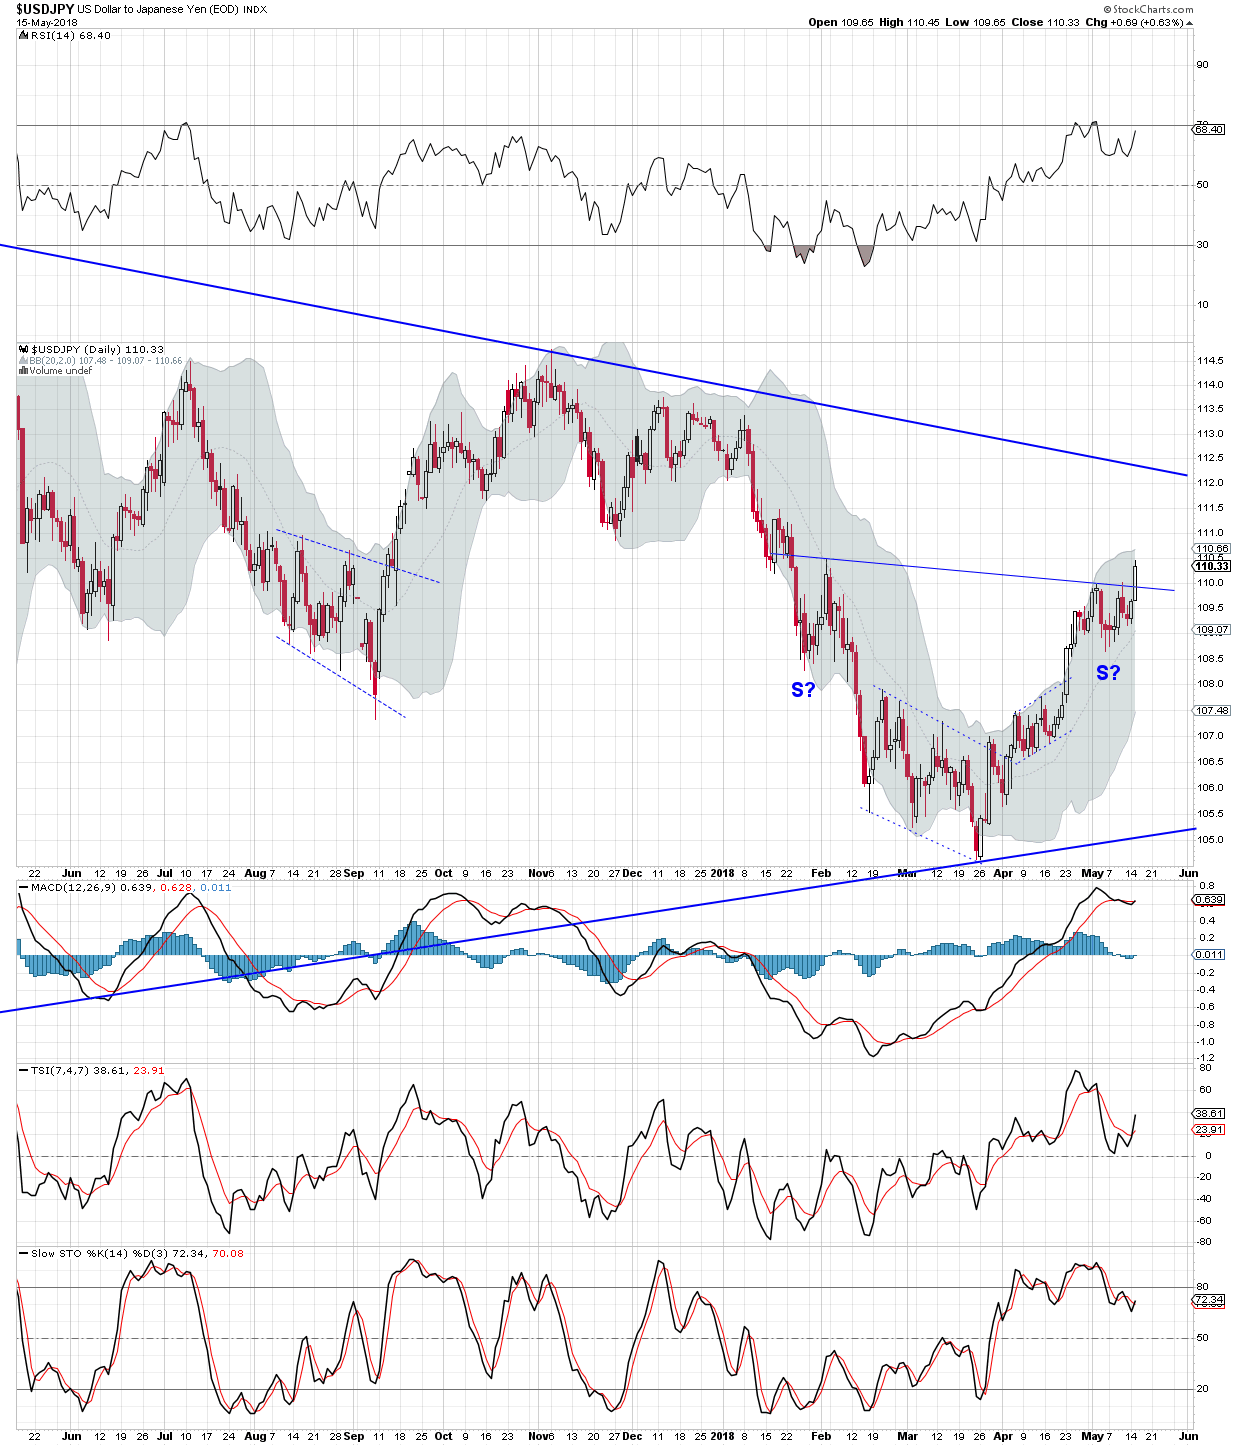
$USDJPY – Daily
Gold bulls won’t want to see $USDJPY break above the down sloping blue trend line. However, if the price objective (PO) of the inverse SHS pattern is fulfilled, $USDJPY should clear 115.0 on this chart.
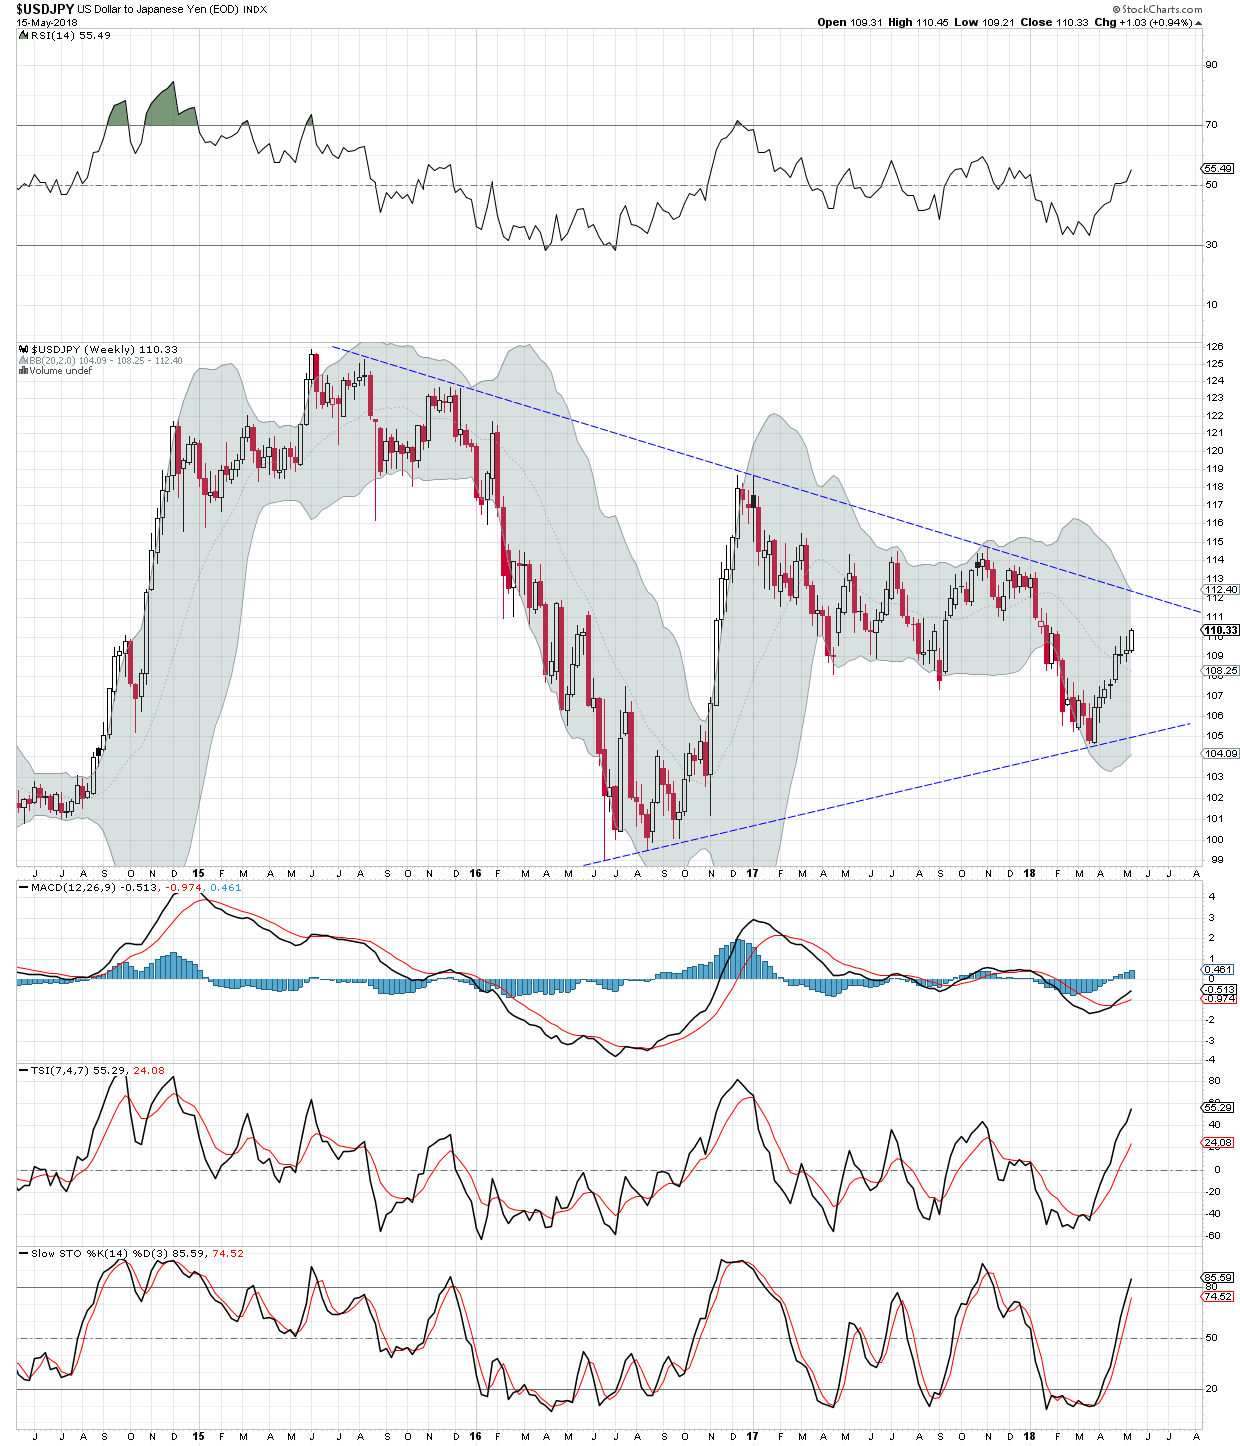
$USDJPY – Weekly
A weekly chart shows the consolidation pattern has been unfolding for about three years.
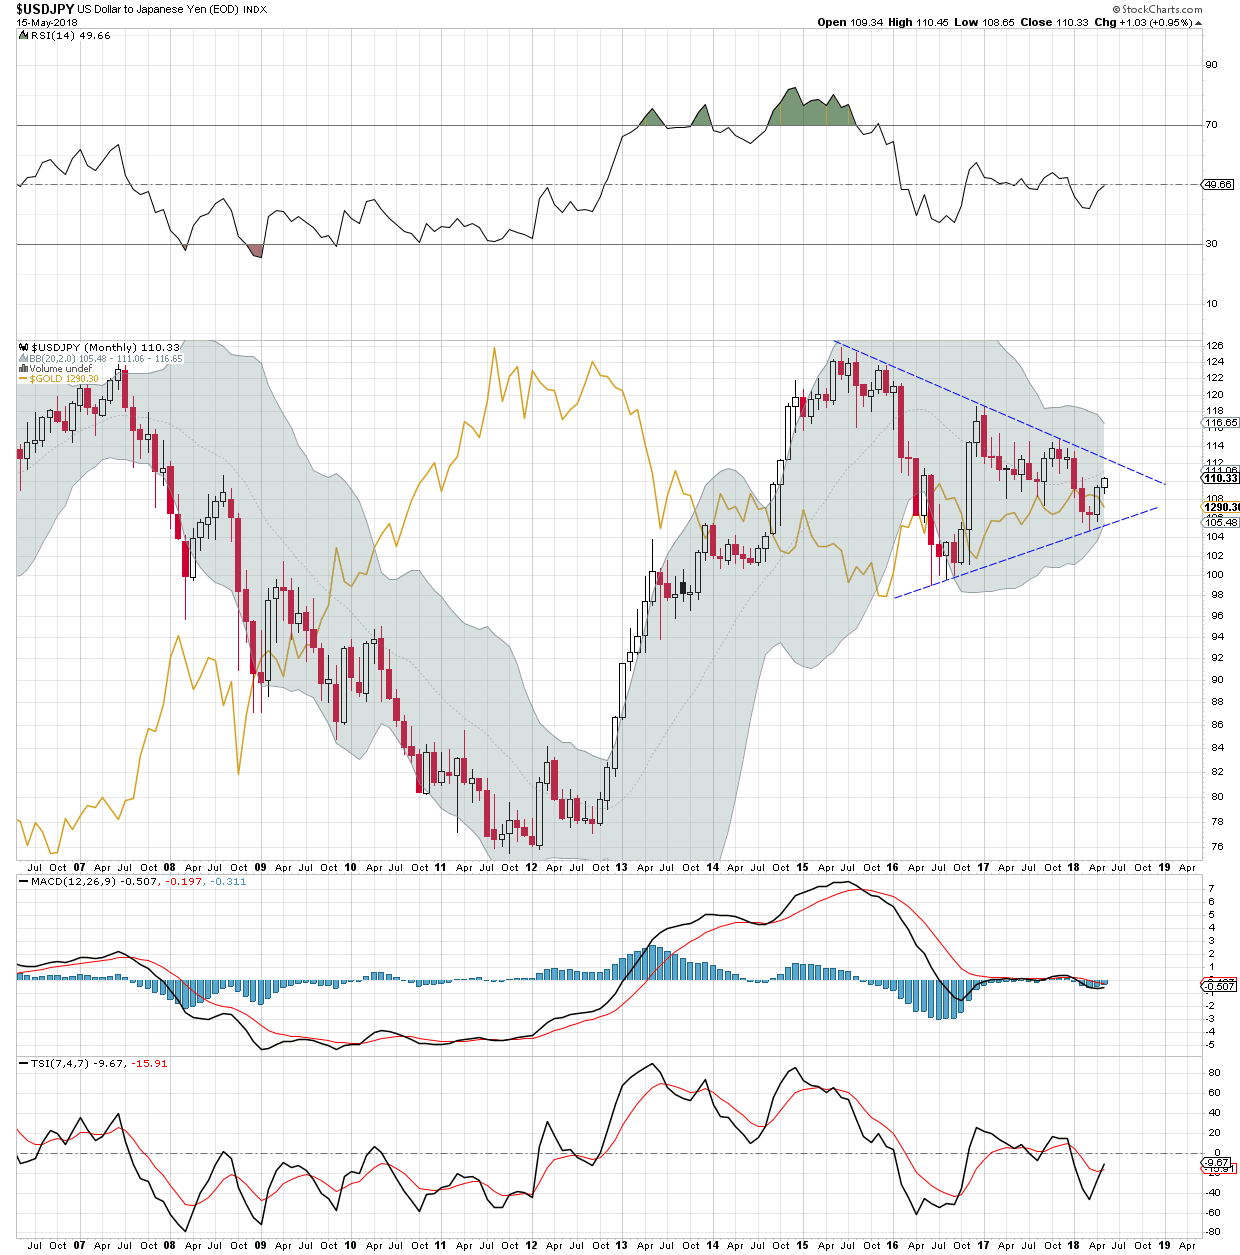
$USDJPY – Monthly, with $GOLD overlay.
This chart shows the currency pair moved inversely to $GOLD in the recent past. It is hard to accept that the triangle pattern that formed over the last three years might be a half way pattern to the upside. Surely not! As speculators we will want keep an open mind and explore all possibilities.