$USD – Weekly Line Charts – and $GOLD Weekly
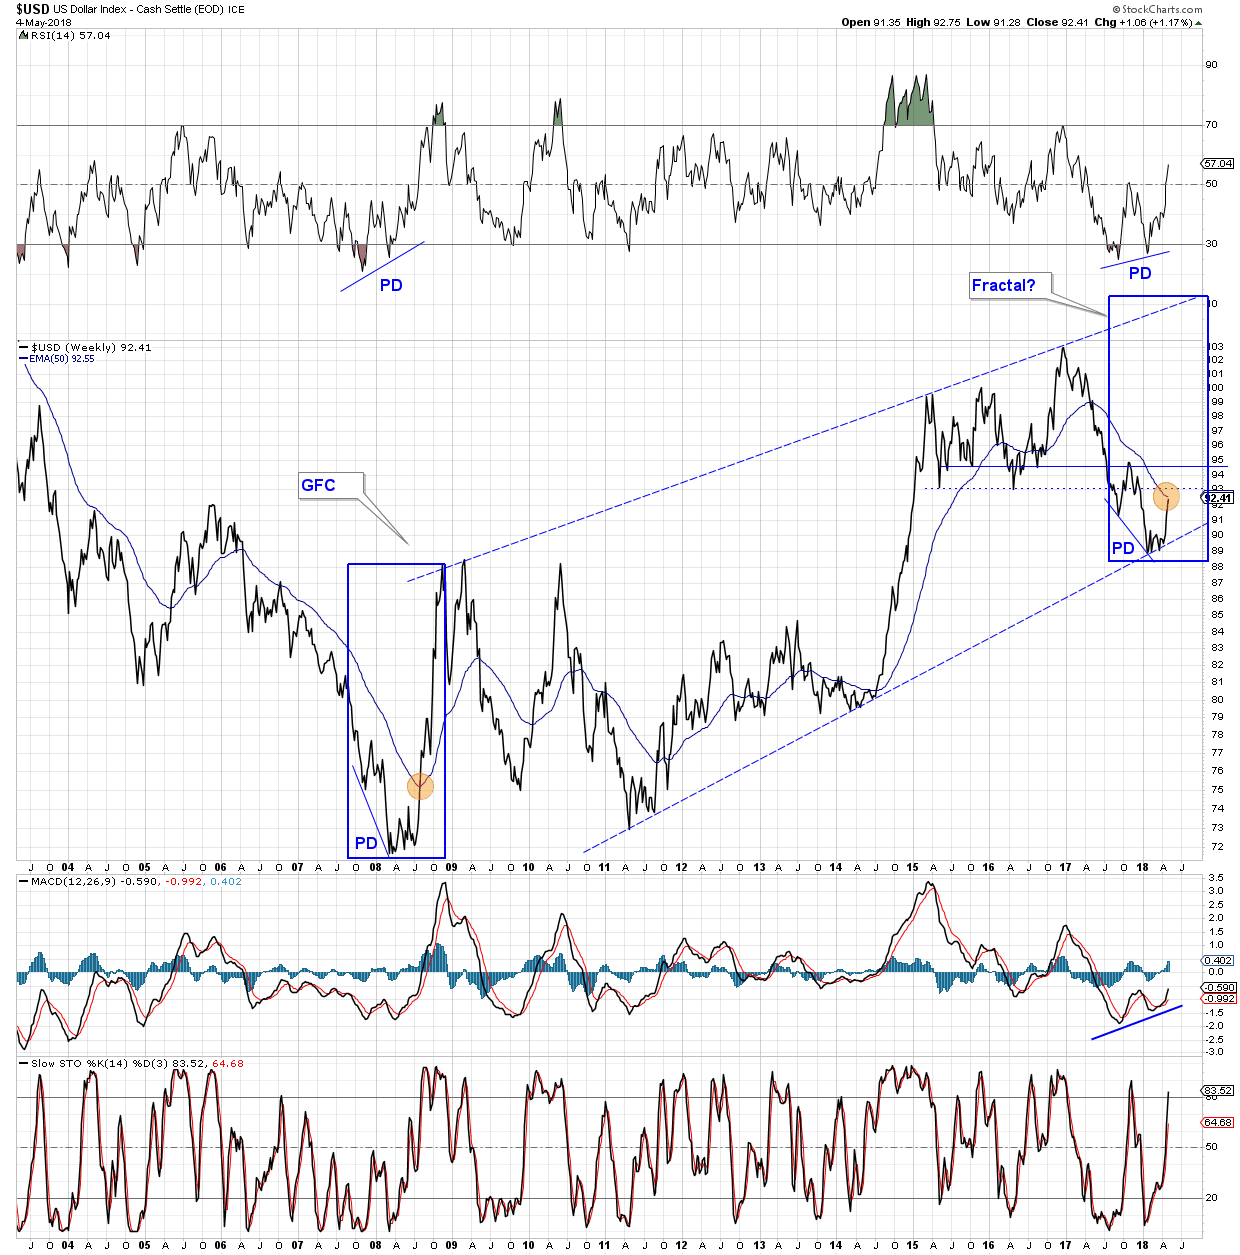
A longer term view here. Setting cycle analysis aside this time on the supposition that the dollar cycle may be delayed or failed (due to CB shenanigans) The recent dollar activity suggests an interesting parallel to 2008 when a stock market top, housing bubble pop, and interest rate rise gave birth to the Great Financial Crisis. If nothing else the fractal is interesting and is something to watch for.
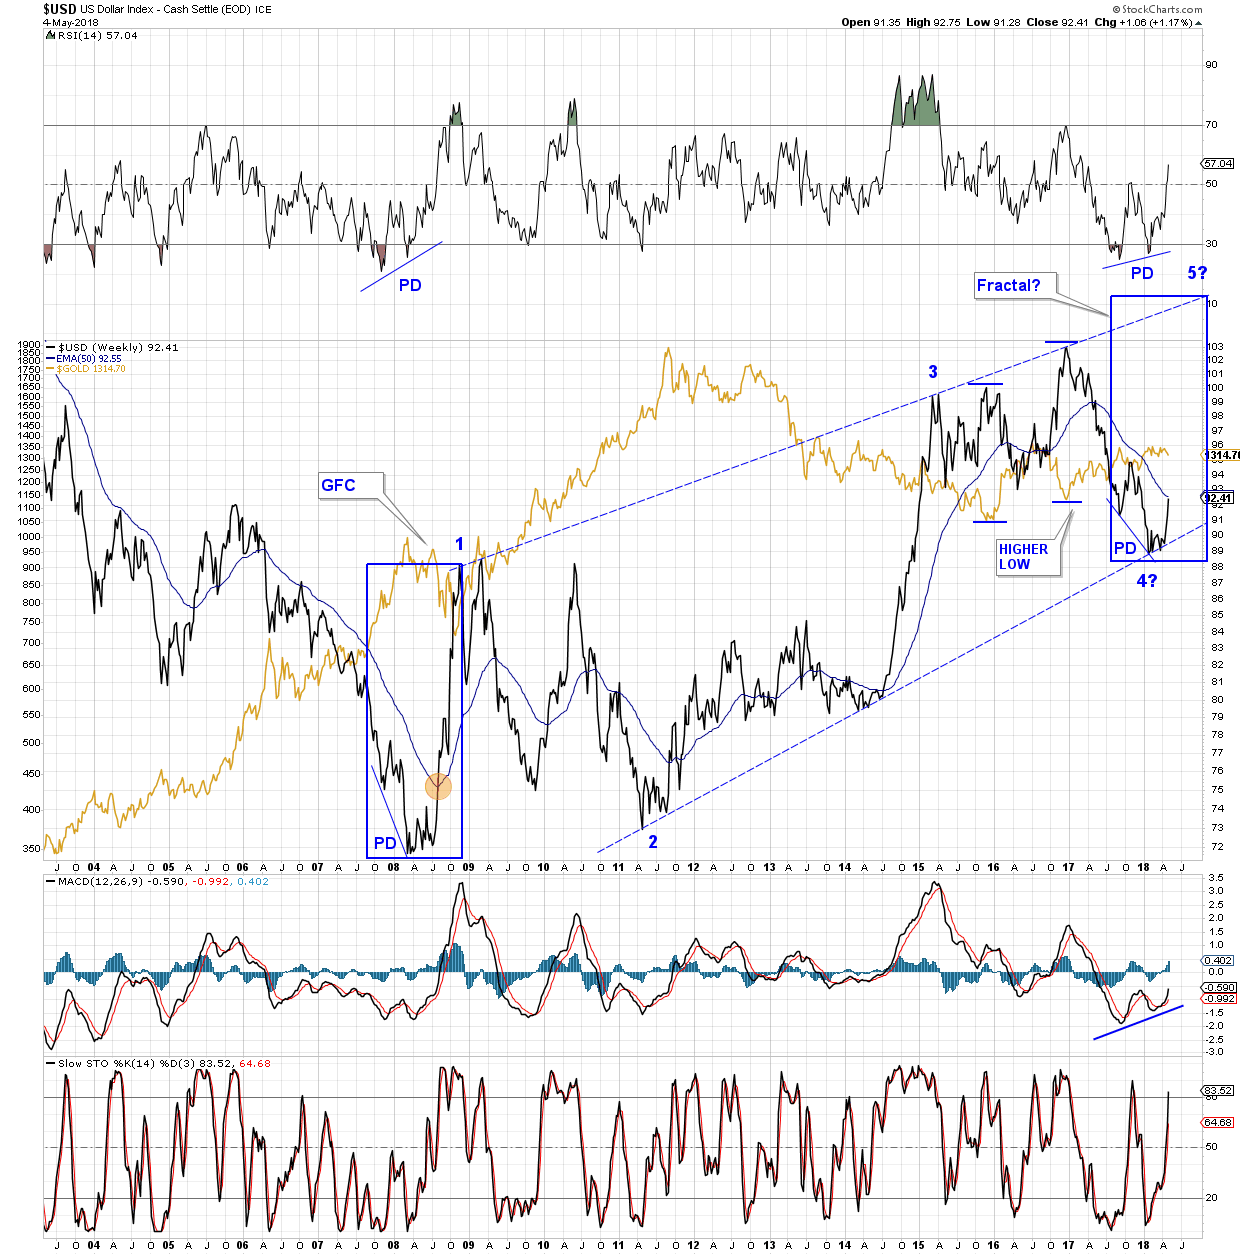
The chart below is basically the same chart, but with $GOLD behind the price. On this chart note that as the dollar made a high in late 2015, GOLD bottomed – we think. After a reaction the dollar then went on to a higher high in late 2016. Did GOLD then make a lower low? No it did not. GOLD made a higher low (Bullish) Certainly GOLD has been weak in the face of the DOLLAR decline to the January 2018 low, but it has also shown resilience while the dollar scoots higher. So is it possible, maybe even probable, that if the dollar goes on to a new high GOLD makes yet another higher low – say $1260 – $1275 ish? From that point, Point “5?” on the chart, one might speculate that the PM bull market resumes with a vengeance. Wild speculation, but…
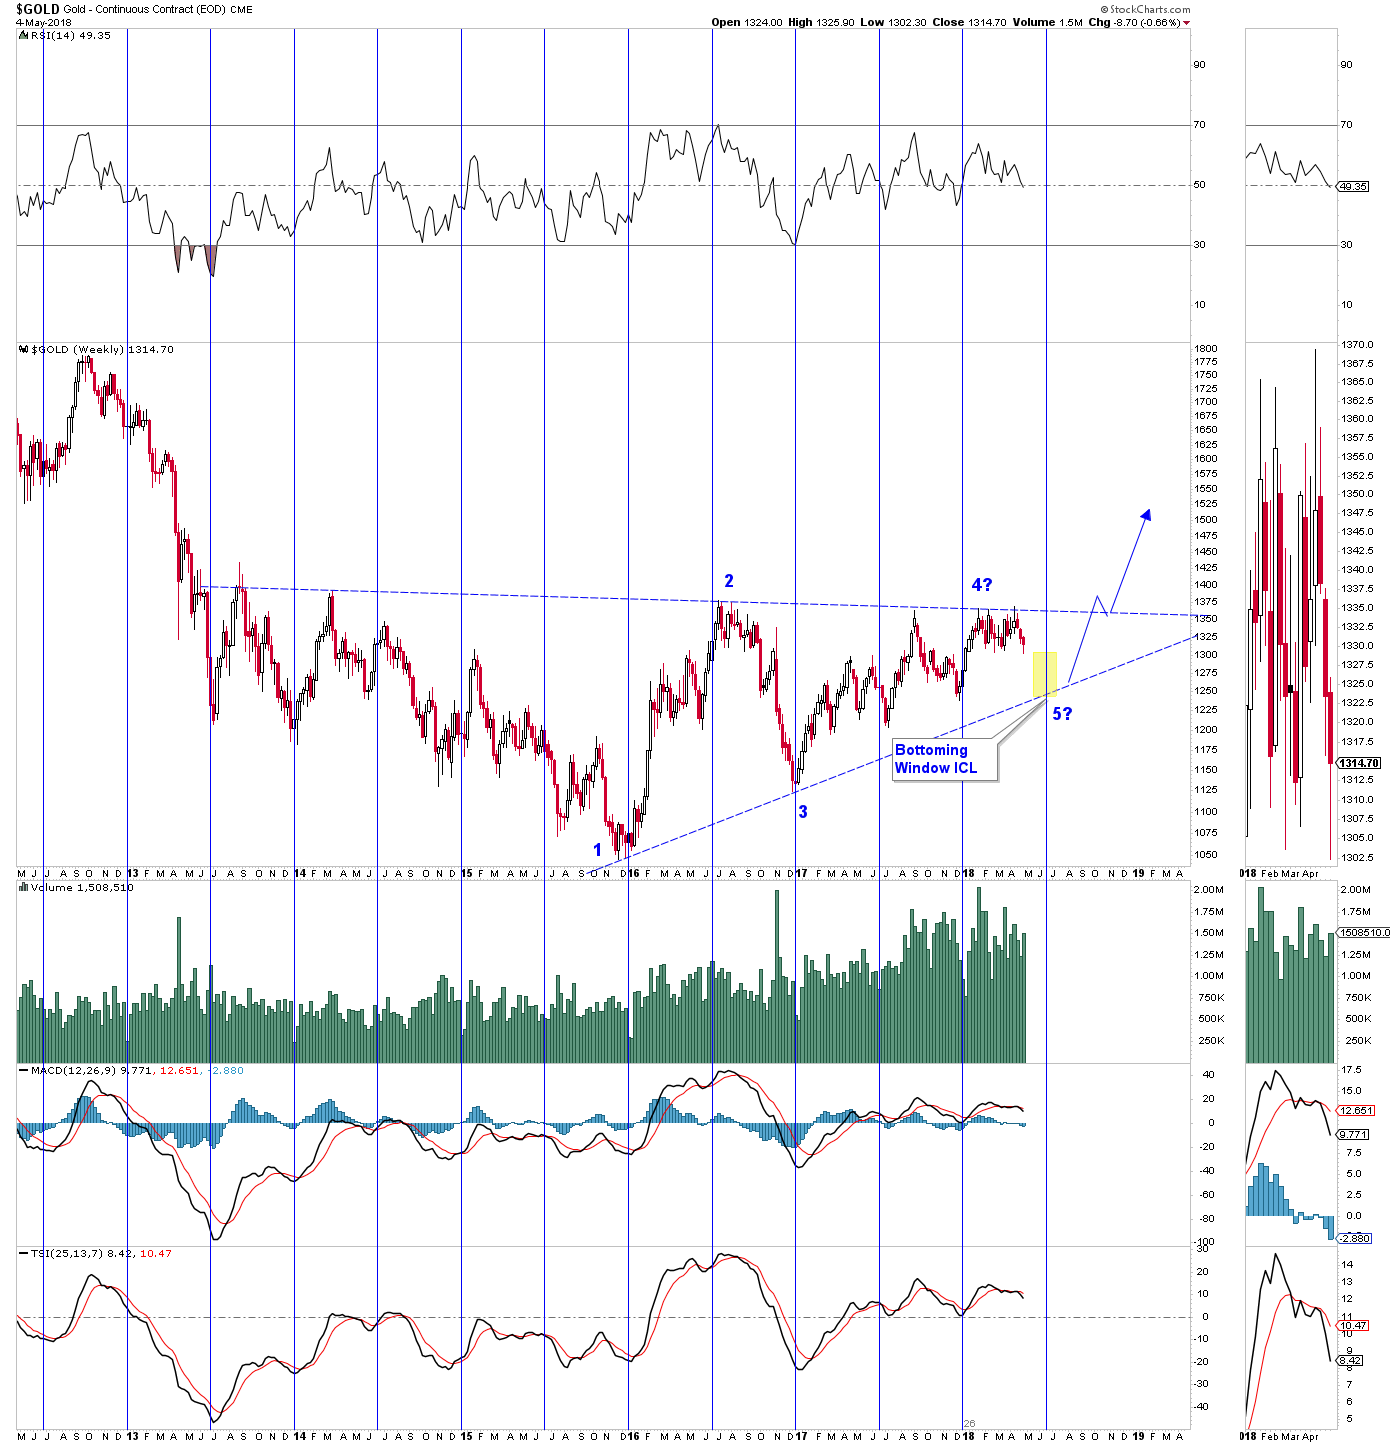
A $GOLD chart with cycle weekly lines has been posted previously. Nothing new here, but it indicates once more a time and dollar frame for a possible turn around in $GOLD and the PMs. Again, its speculation.
I apologize, Audept and Fully, for spamming the page. It didn’t start out that way.
Thanks for sharing this.
Sir Fox :
If this is spam…bring us more.
It’s brilliant !
Thanks for the vote of confidence, Sir Fully. Writing it out does help clarify one’s thinking. Just trying to make sense of a difficult market that has bearish indications (technically) but really ought to be bullish.
I know you have preempted your post with “setting aside cycle analysis” but I wish to clarify that 2008 was actually the end of the 15 year USD cycle and currently we are at the beginning of the 7.5-8 year downside of the following 15 year cycle.
The 50 week moving average capped the advances from 2002-2005 so will be interesting to see whether it does the same this time around.
Thanks for the clarification, Norvast. The 50 WMA resistance is something Northstar mentioned. I think we are all waiting to see if it turns back the dollar rally. Personally, I hope it does, but don’t expect it will.
Today 07 May the USD is only on calendar day 20 within this daily cycle which is too early IMO to host a DCH.
That means gold could re-test the 01 May level by the end of the week.
I hope the next gold ICL (your point 5 on last chart), which I expect in mid Jun, is higher than 1237 but that will much depend on the strength of the USD going into it’s next daily cycle.
Very good chart Silver Fox, thanks.
Thank you. Lots to watch out for in coming weeks.