Yield Curve
I don’t know much about this topic but Gabe brought it up ….so I went back 45 years with this chart ( where the data starts.)
This is the 10 year US Bond Yield over the 2 Year….I am not sure what significance this has or even if it is the correct pair to analyse ..However it seems reasonable to say that it has just normalized after a HUGE spike following the GFC.
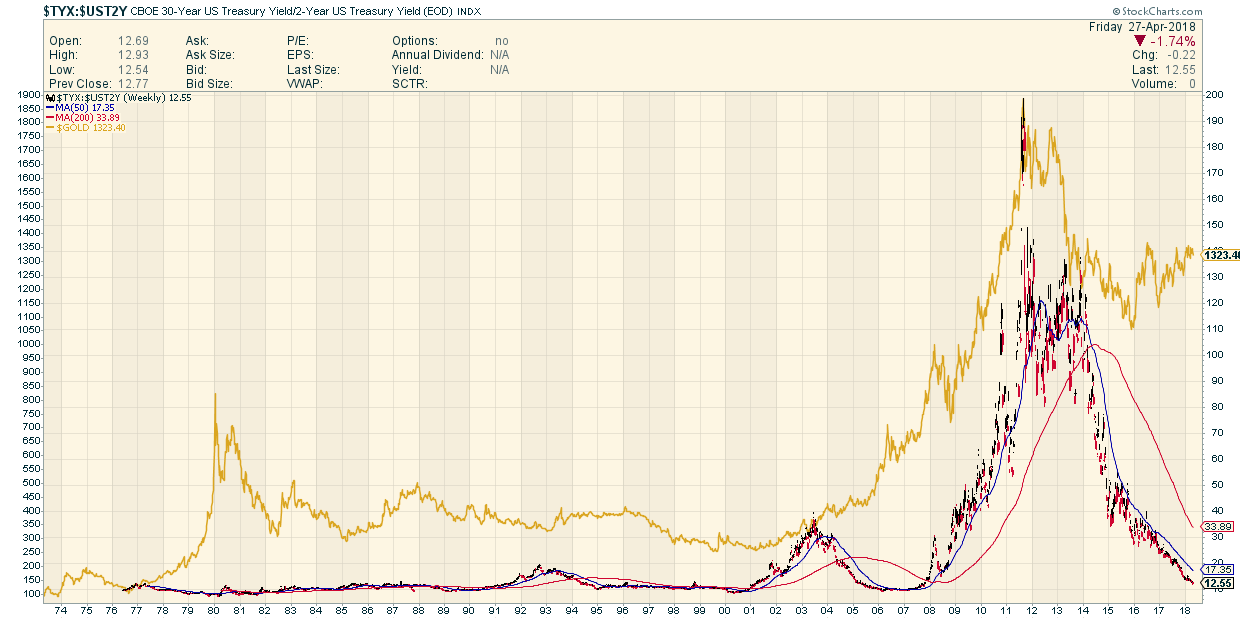
Who Knew ? That the great Gold Parabola followed the Great Expansion of this Yield Curve and they both topped together.
However again the 1980 God Parabola had nothing to do with this yield curve .
Again this looks like a “normalization” in this curve…..I must be missing something …I didn’t notice the 10 year bond prices jumping with Gold ….so I suppose it was the 2 years that dropped causing this spike in the curve.
Anyhow are there any Bond Guys out there who can shed some light on why this ratio jumped and why it seemd to spark Gold ?
Fully, Good chart and good question. I don’t pretend to know anything about the yield curve to gold correlation. Simply looking at your chart my observation is there is no direct correlation.
Inversions precede recessions as real rates have topped and have done their damage.
Recessions precede easing, when real rates drop sharply.
YC normalizations amount to monetary catchup, and so real rates climb.
Gold likes falling and low real rates.
Hates rising and high real rates.
Chart probably needs to (a) subtract 2 and 10. Then chart the rate of change of that difference and relate that to ROC of gold.