$VIX vs Stock Markets
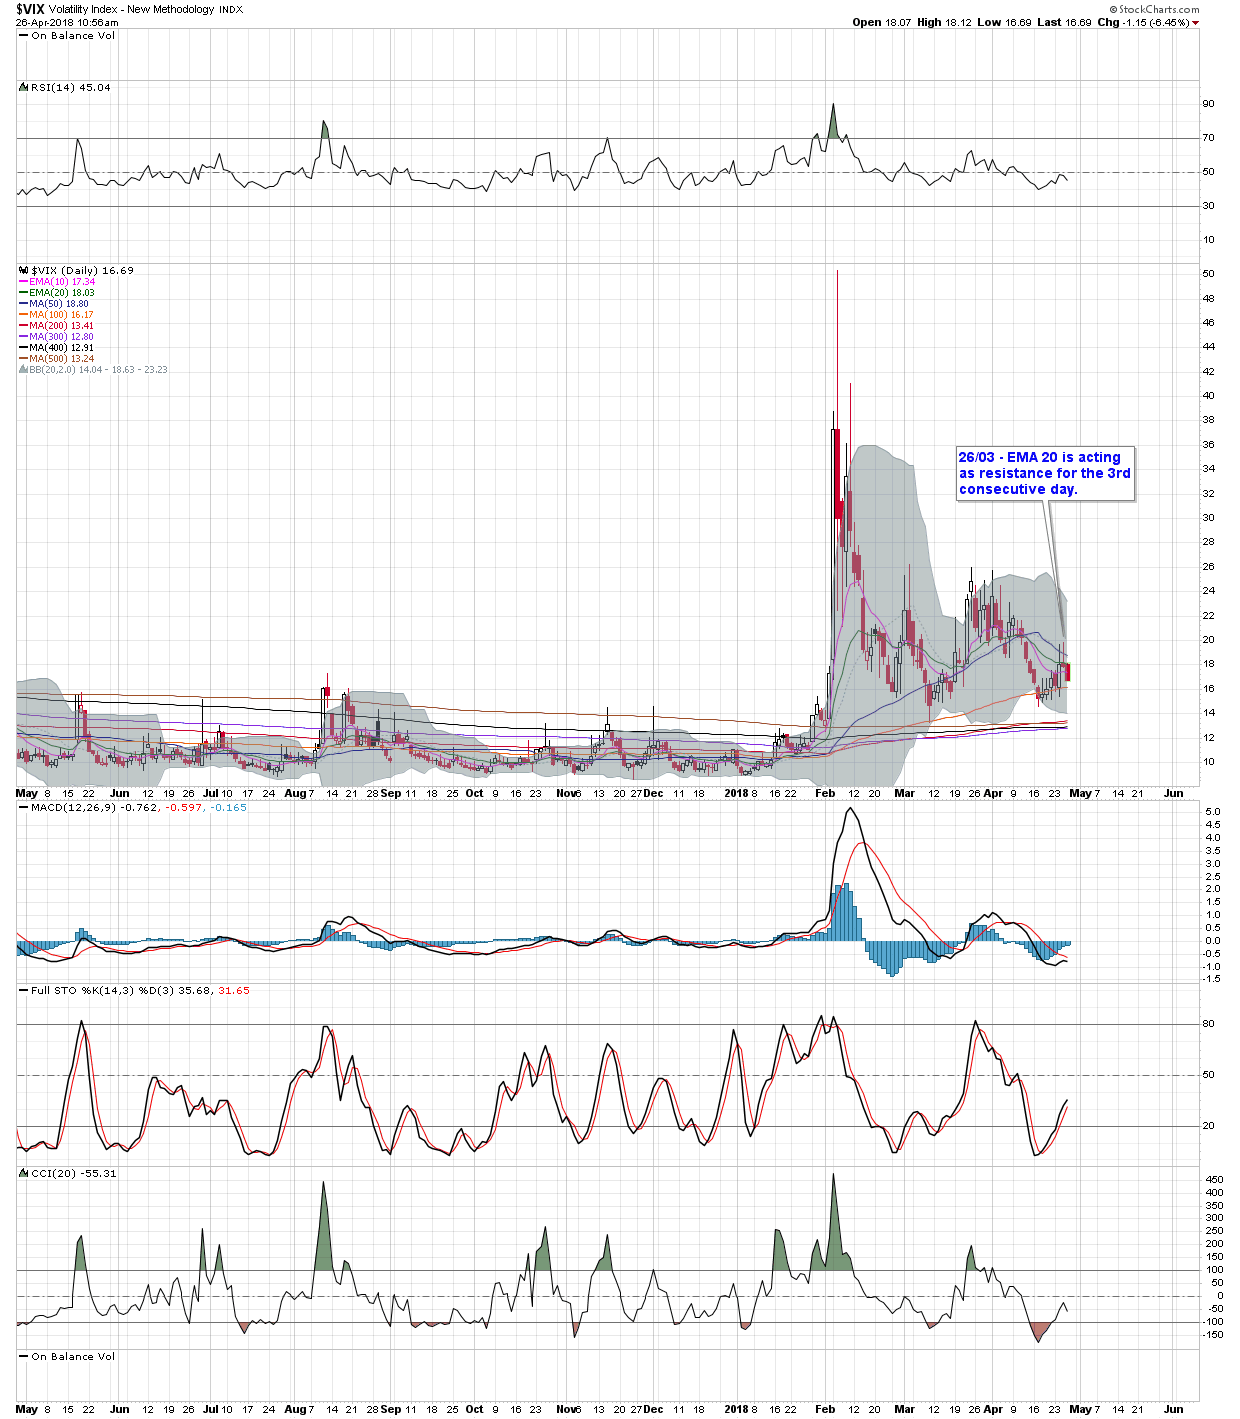

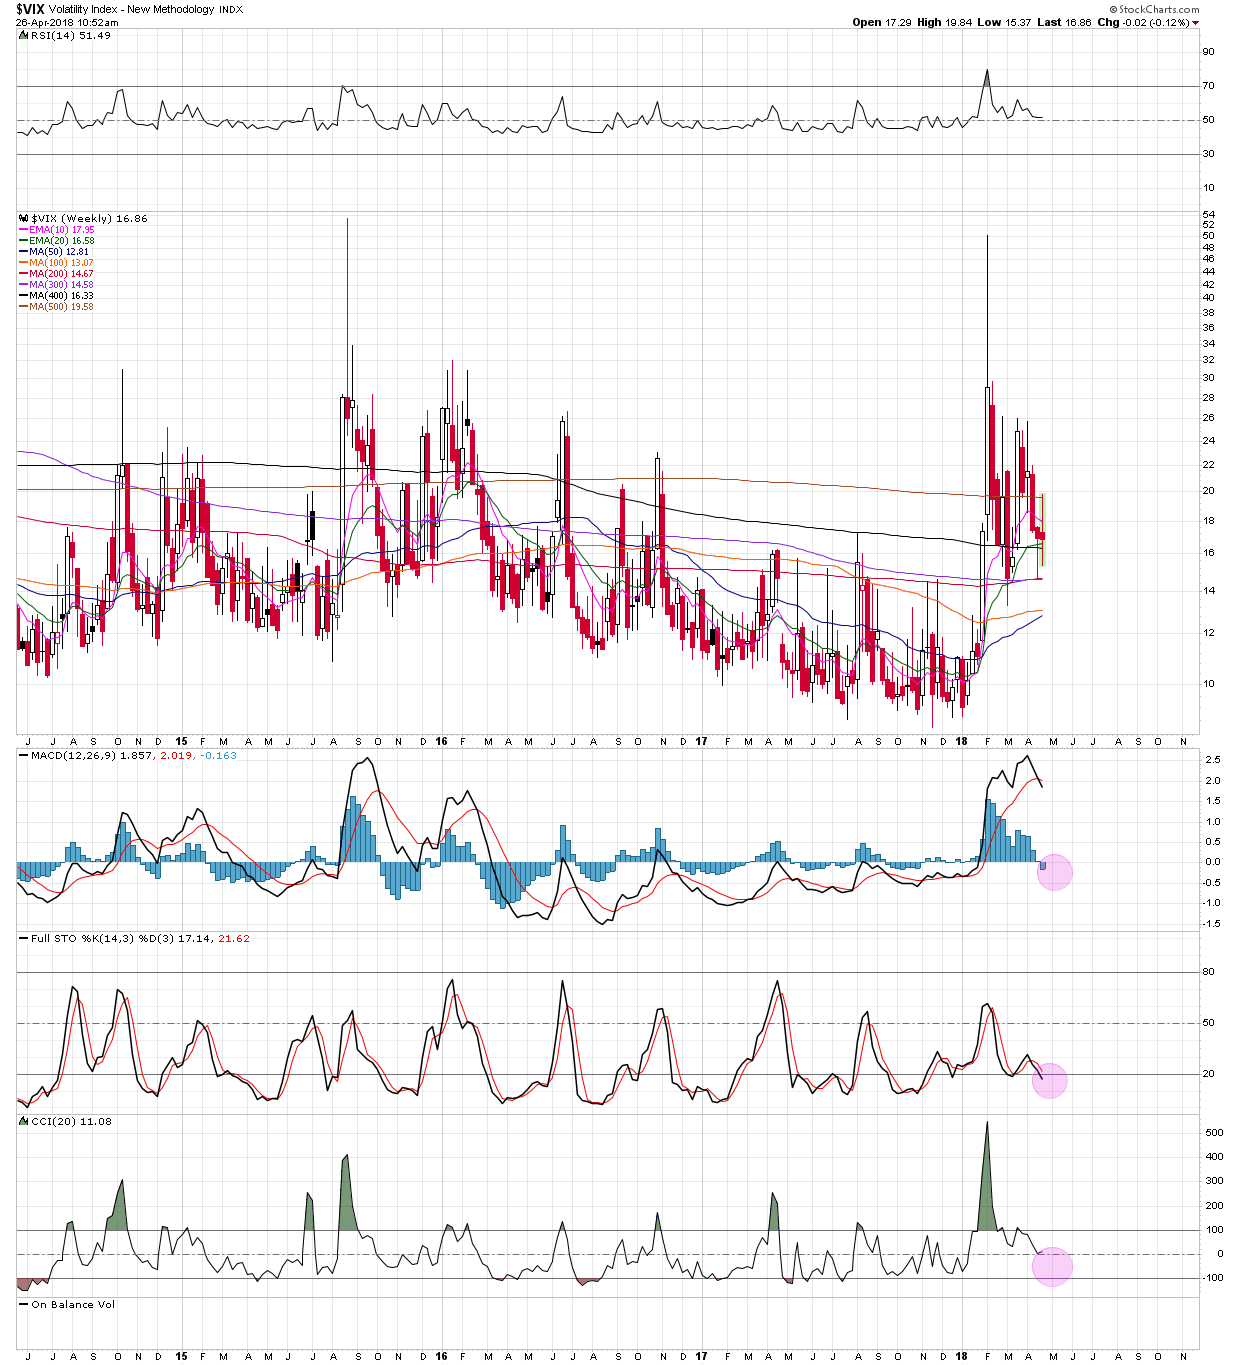
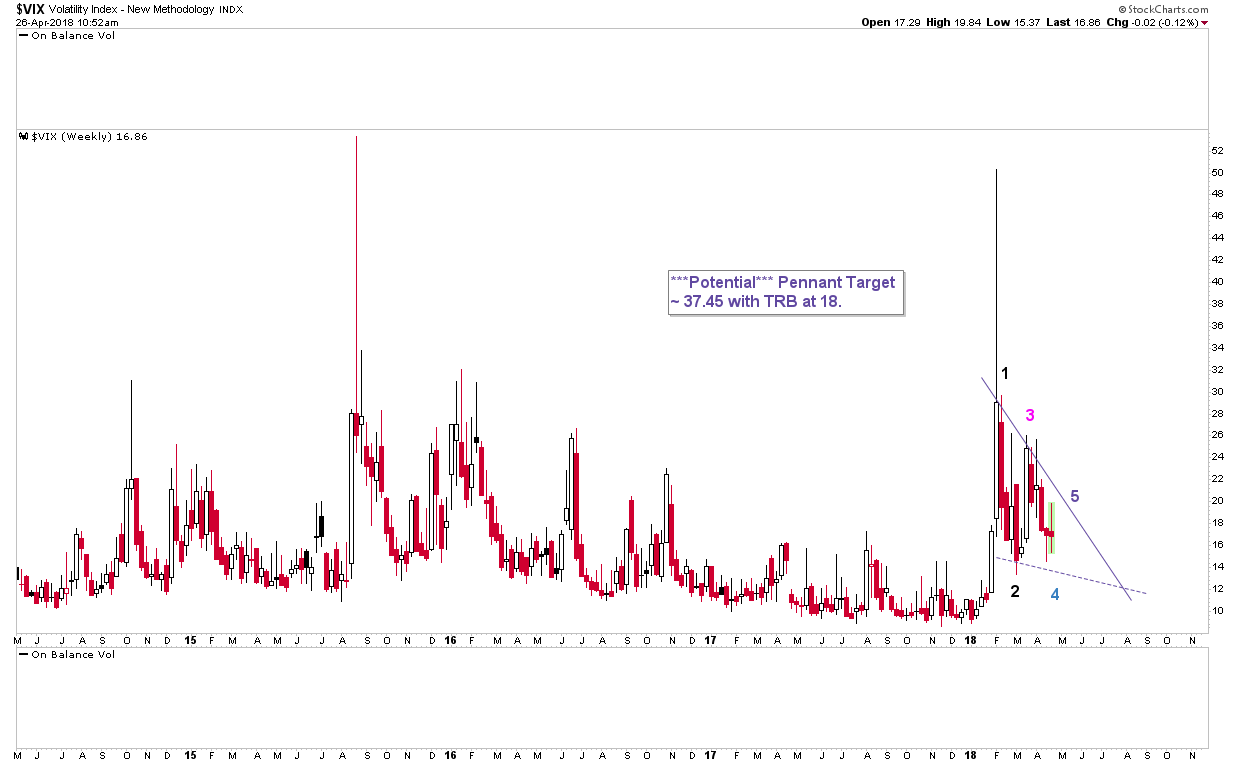
Chart 1 – Daly SMA’s 200, 300, 400 & 500 are all bunched together between 12 & 14.
Chart 2 – There is an unfilled gap from early Feb at 13.56.
Chart 3 – Weekly SMA 50 & 100 are at approximately 13. MACD, STO & CCI look as though they need to fall a little further so that $VIX is “reset”
ready for the next ‘up-leg’ in equity vol and ‘down-leg’ in stock markets.
Chart 4 – Self-explanatory
FOMC on the 2nd.