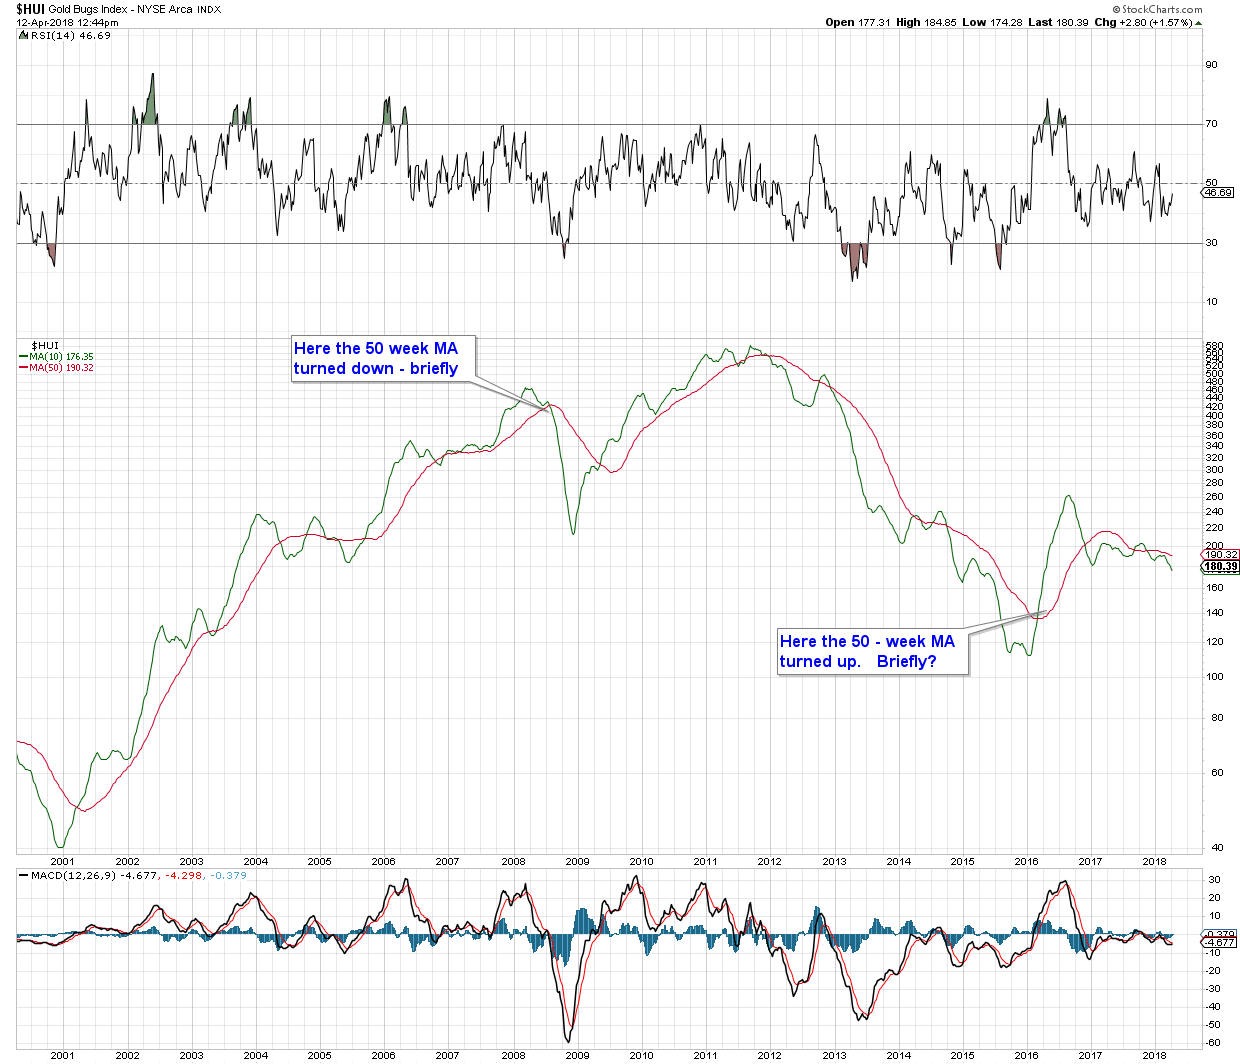
$HUI – Invisible
To keep a balanced perspective, here’s one for the PM bears. Its a similar chart to the invisible 10 WMA /50 WMA $GOLD chart, but charting $HUI instead of $GOLD. Stocks are more volatile, so there are more crosses on the 50 WMA. Of note in the 2001 – 2012 PM bull market the 50 WMA turned down only once. That was in response to the Great Financial Crisis of 2008. It turned up again in 2009 (shake out for the bulls) and finally the 50 WMA peaked a few years later in 2011.
In late 2012 the 50 WMA turned down in earnest.
The 50 WMA turned up in Q2 2016, signalling a bull market, but TURNED DOWN again in Q2 2017 (shake out for the bears?) It is still possible the bottom may not yet be in. Just something to keep in mind.
Question: is the metal leading the miners, or are the miners leading the metal?
(Disclosure – this potential inverse parallel move was first proposed by Parabolic Chuck a few years back)
Thanks Silver Fox. That is indeed a very valid chart for the bear case. I’ll keep it in mind.