Random Silver
It is hard to ignore Silver at the moment. This is what I have been looking at over the last couple weeks. It is an interesting mix that doesn’t really mirror any particular moment in history.
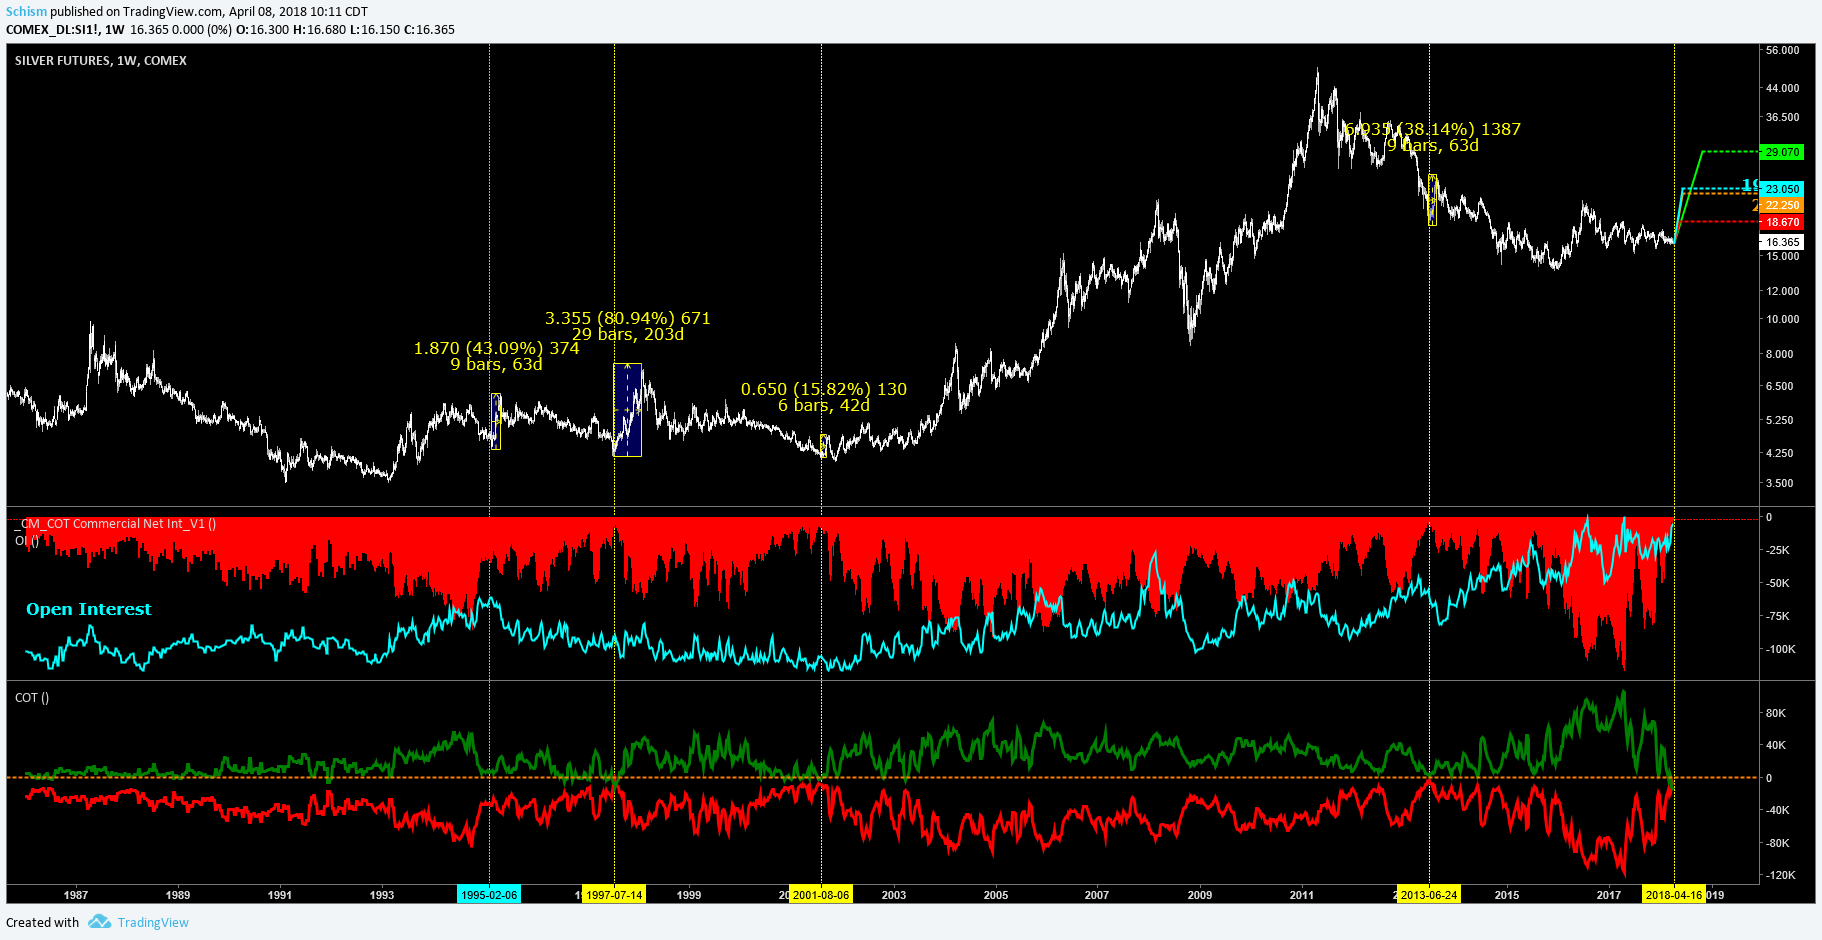
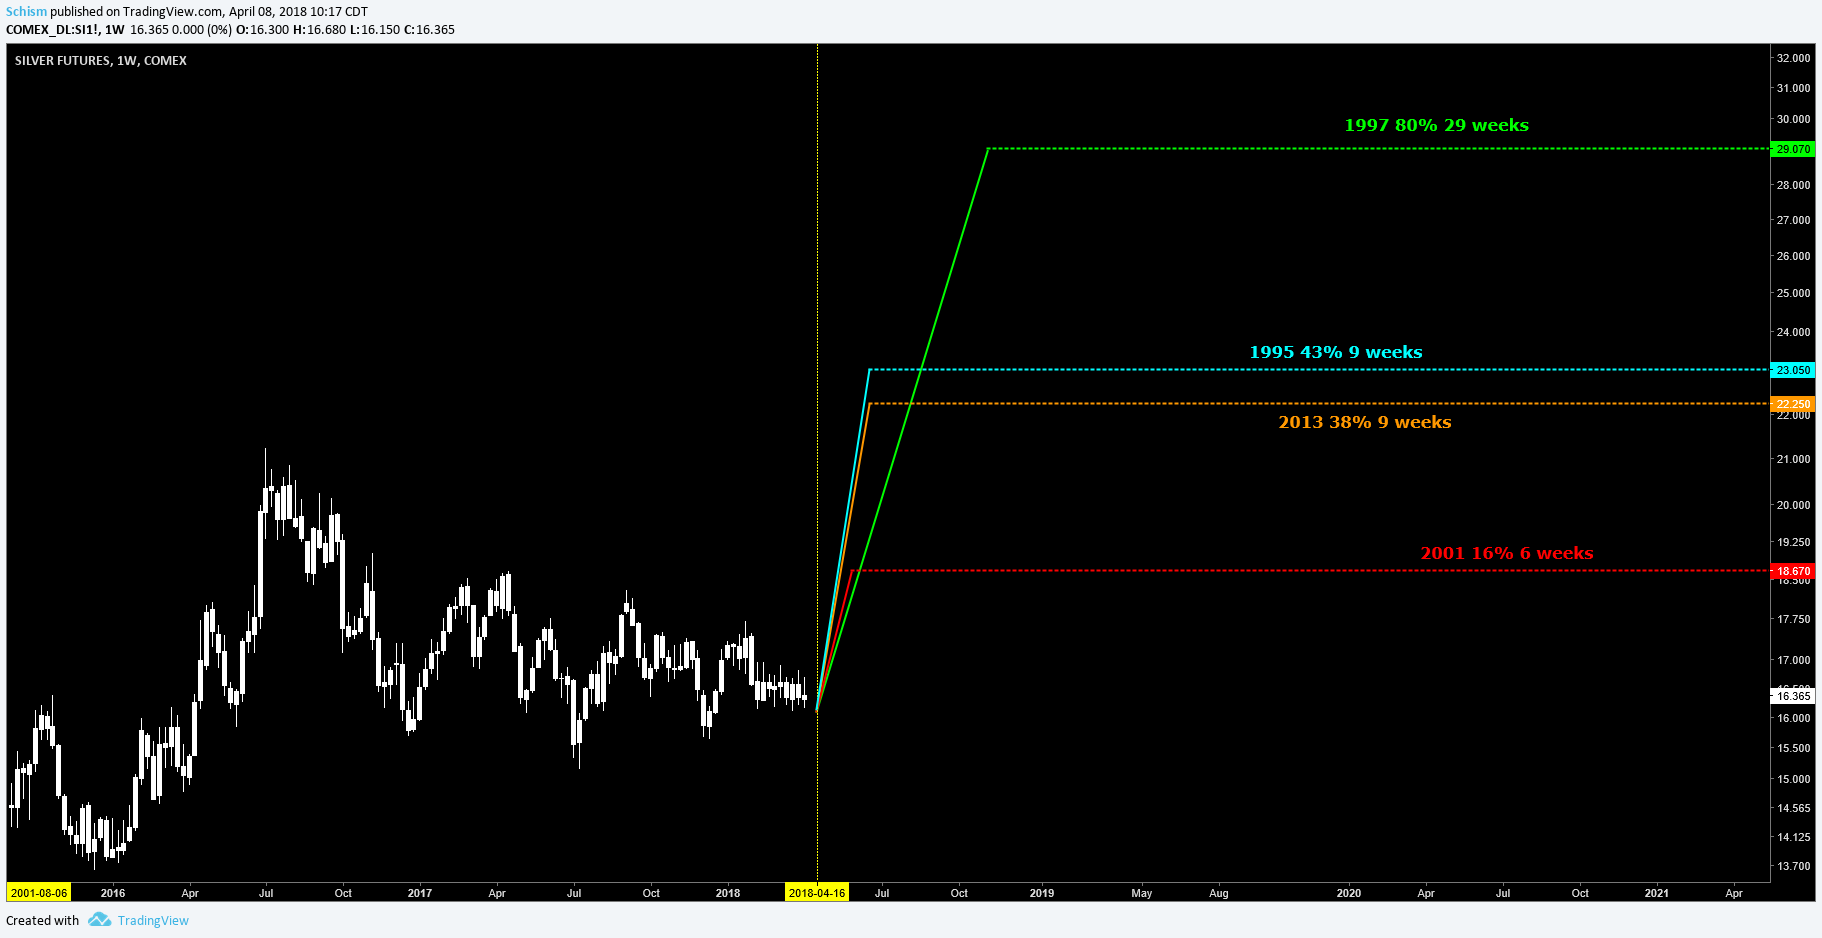
Meaning that the mix of high open interest and low commercial shorts. The closest match with high OI appears to be 1995 which had record OI but the COMMS don’t match that well. Regardless, I just highlighted 4 instances in time where the COMMS were indicating a rally. I then took those instances and placed a starting point from a 4/16 turn date that looks interesting to me and then showed the performances from the previous points in time. Interestingly enough 2 of the runs in the past are roughly 9 weeks and 40% which would put a top in mid june where I believe a good sized Fibonacci vibration maybe hiding. If June is not a high then odds fall for a run into the end of the year imo.
I don’t really know what to make of the COT because everybody and there mom is highlighting the commercial data recently, rightly so I may add. But I do wonder if this is a setup for a June bull trap yearly high or a set up for a big real deal 30-35 week/80-100% move. Shall see
https://www.tradingview.com/x/cjRzJsHm/
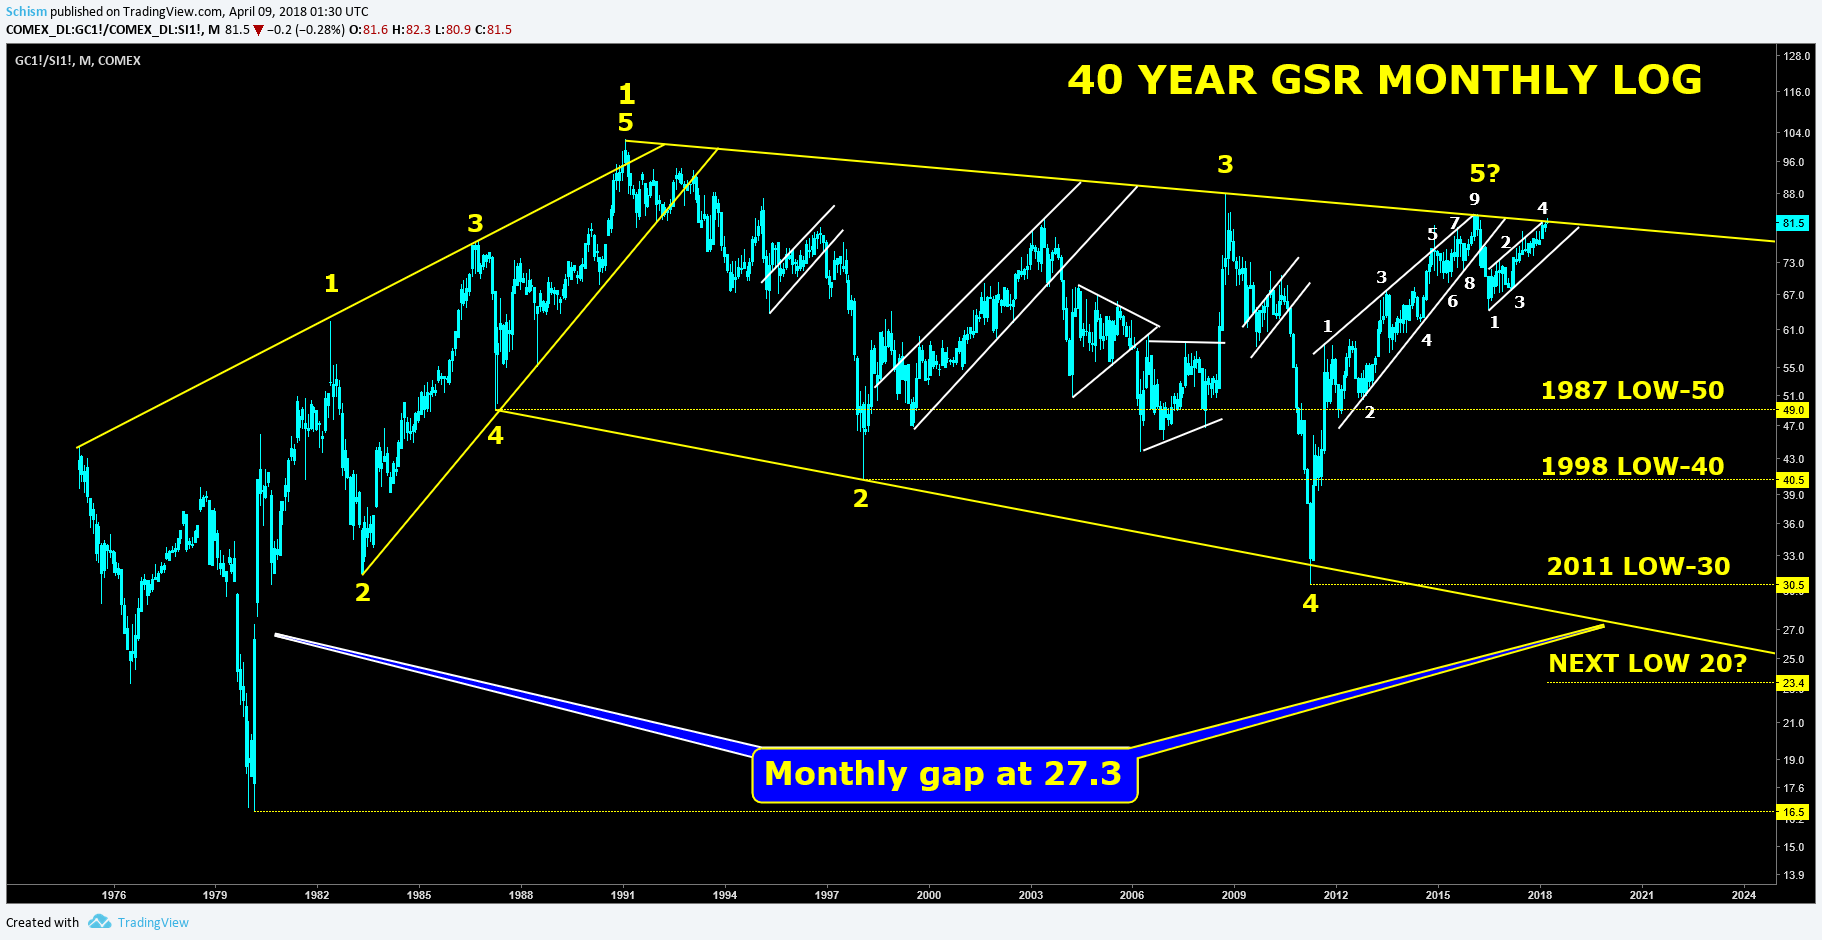
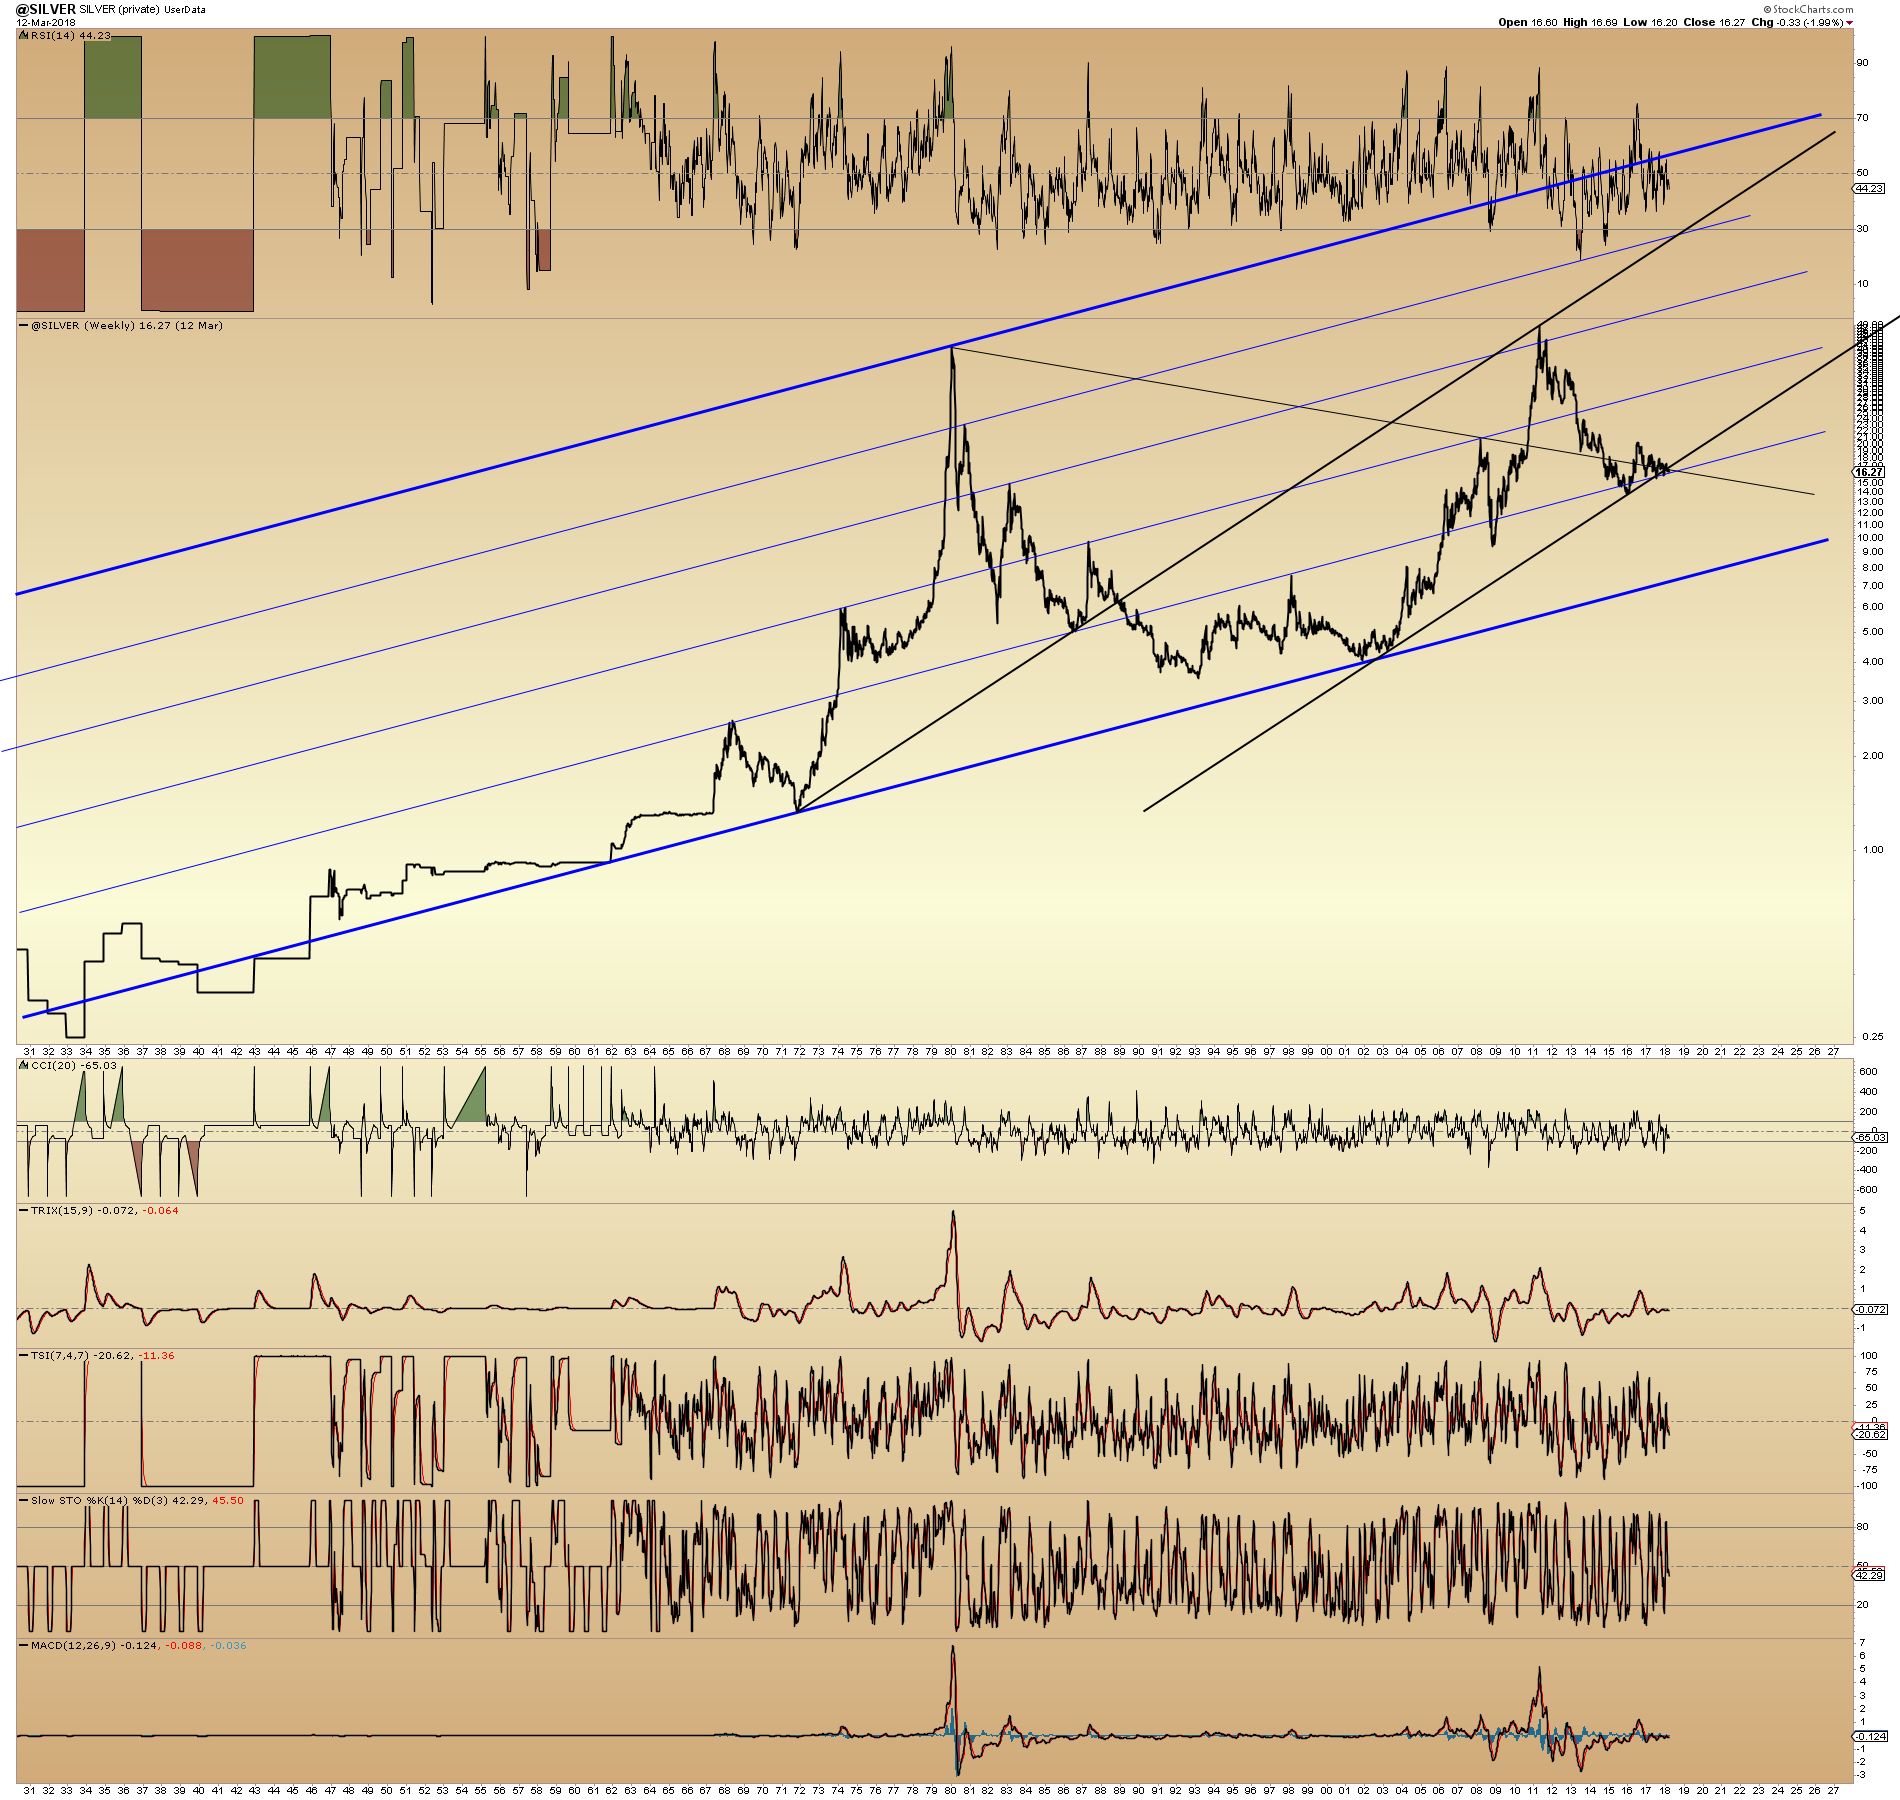
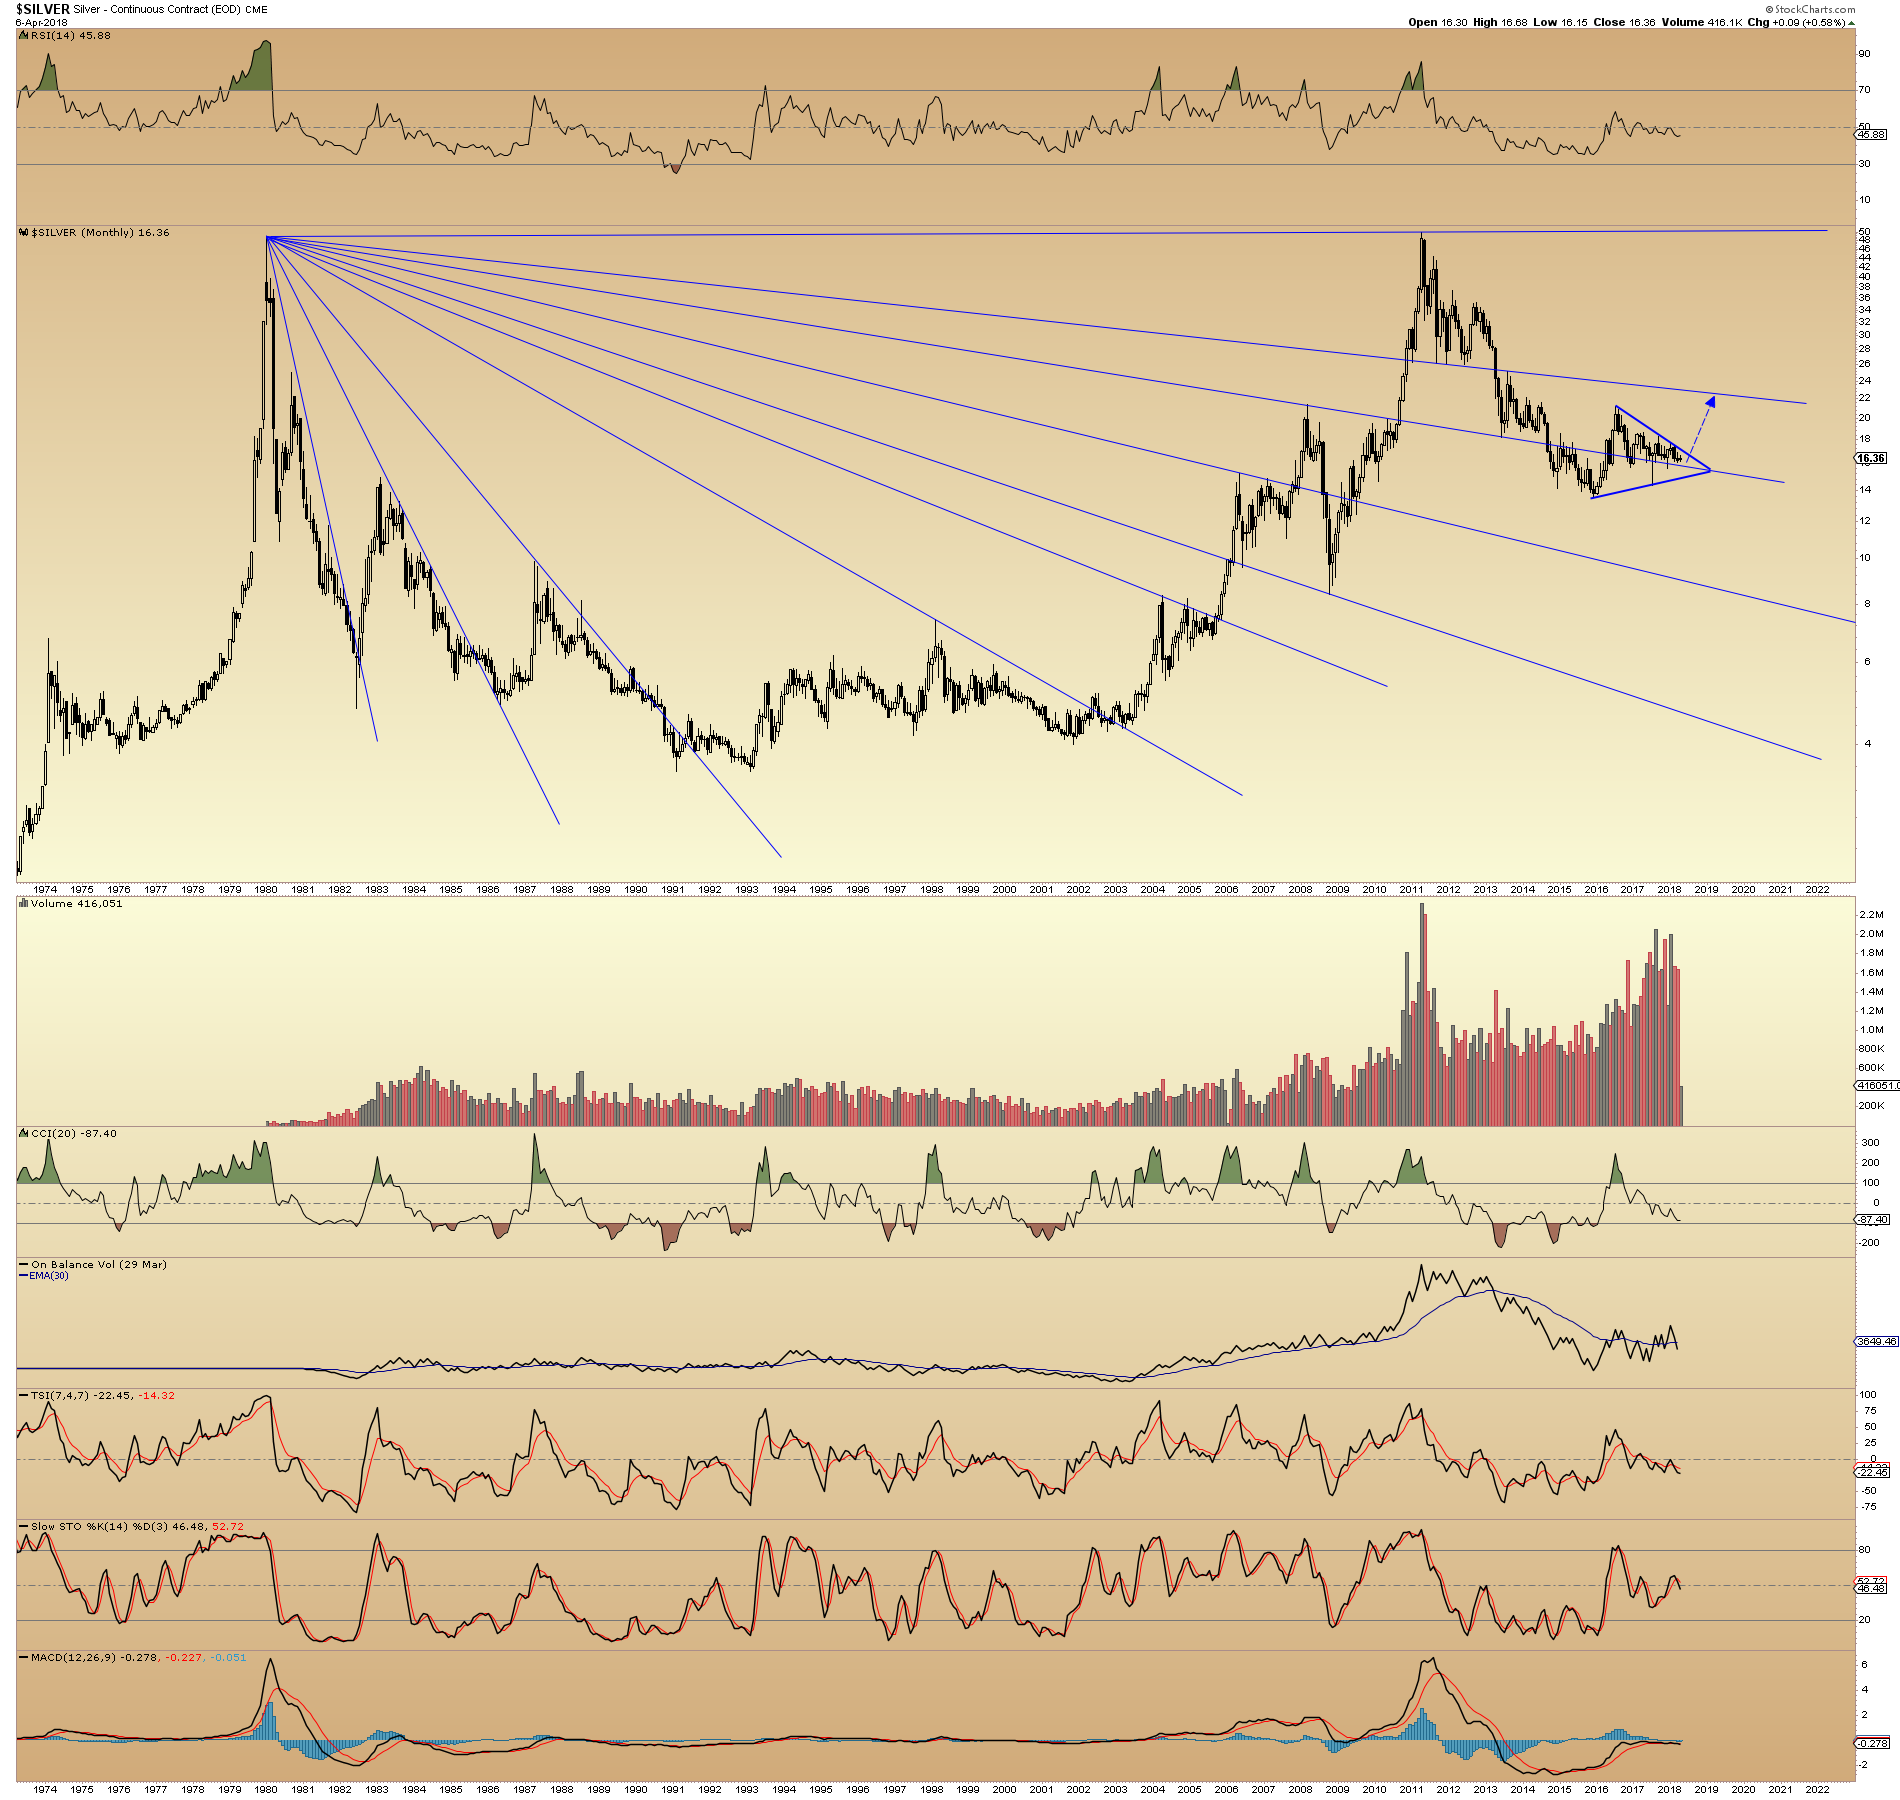
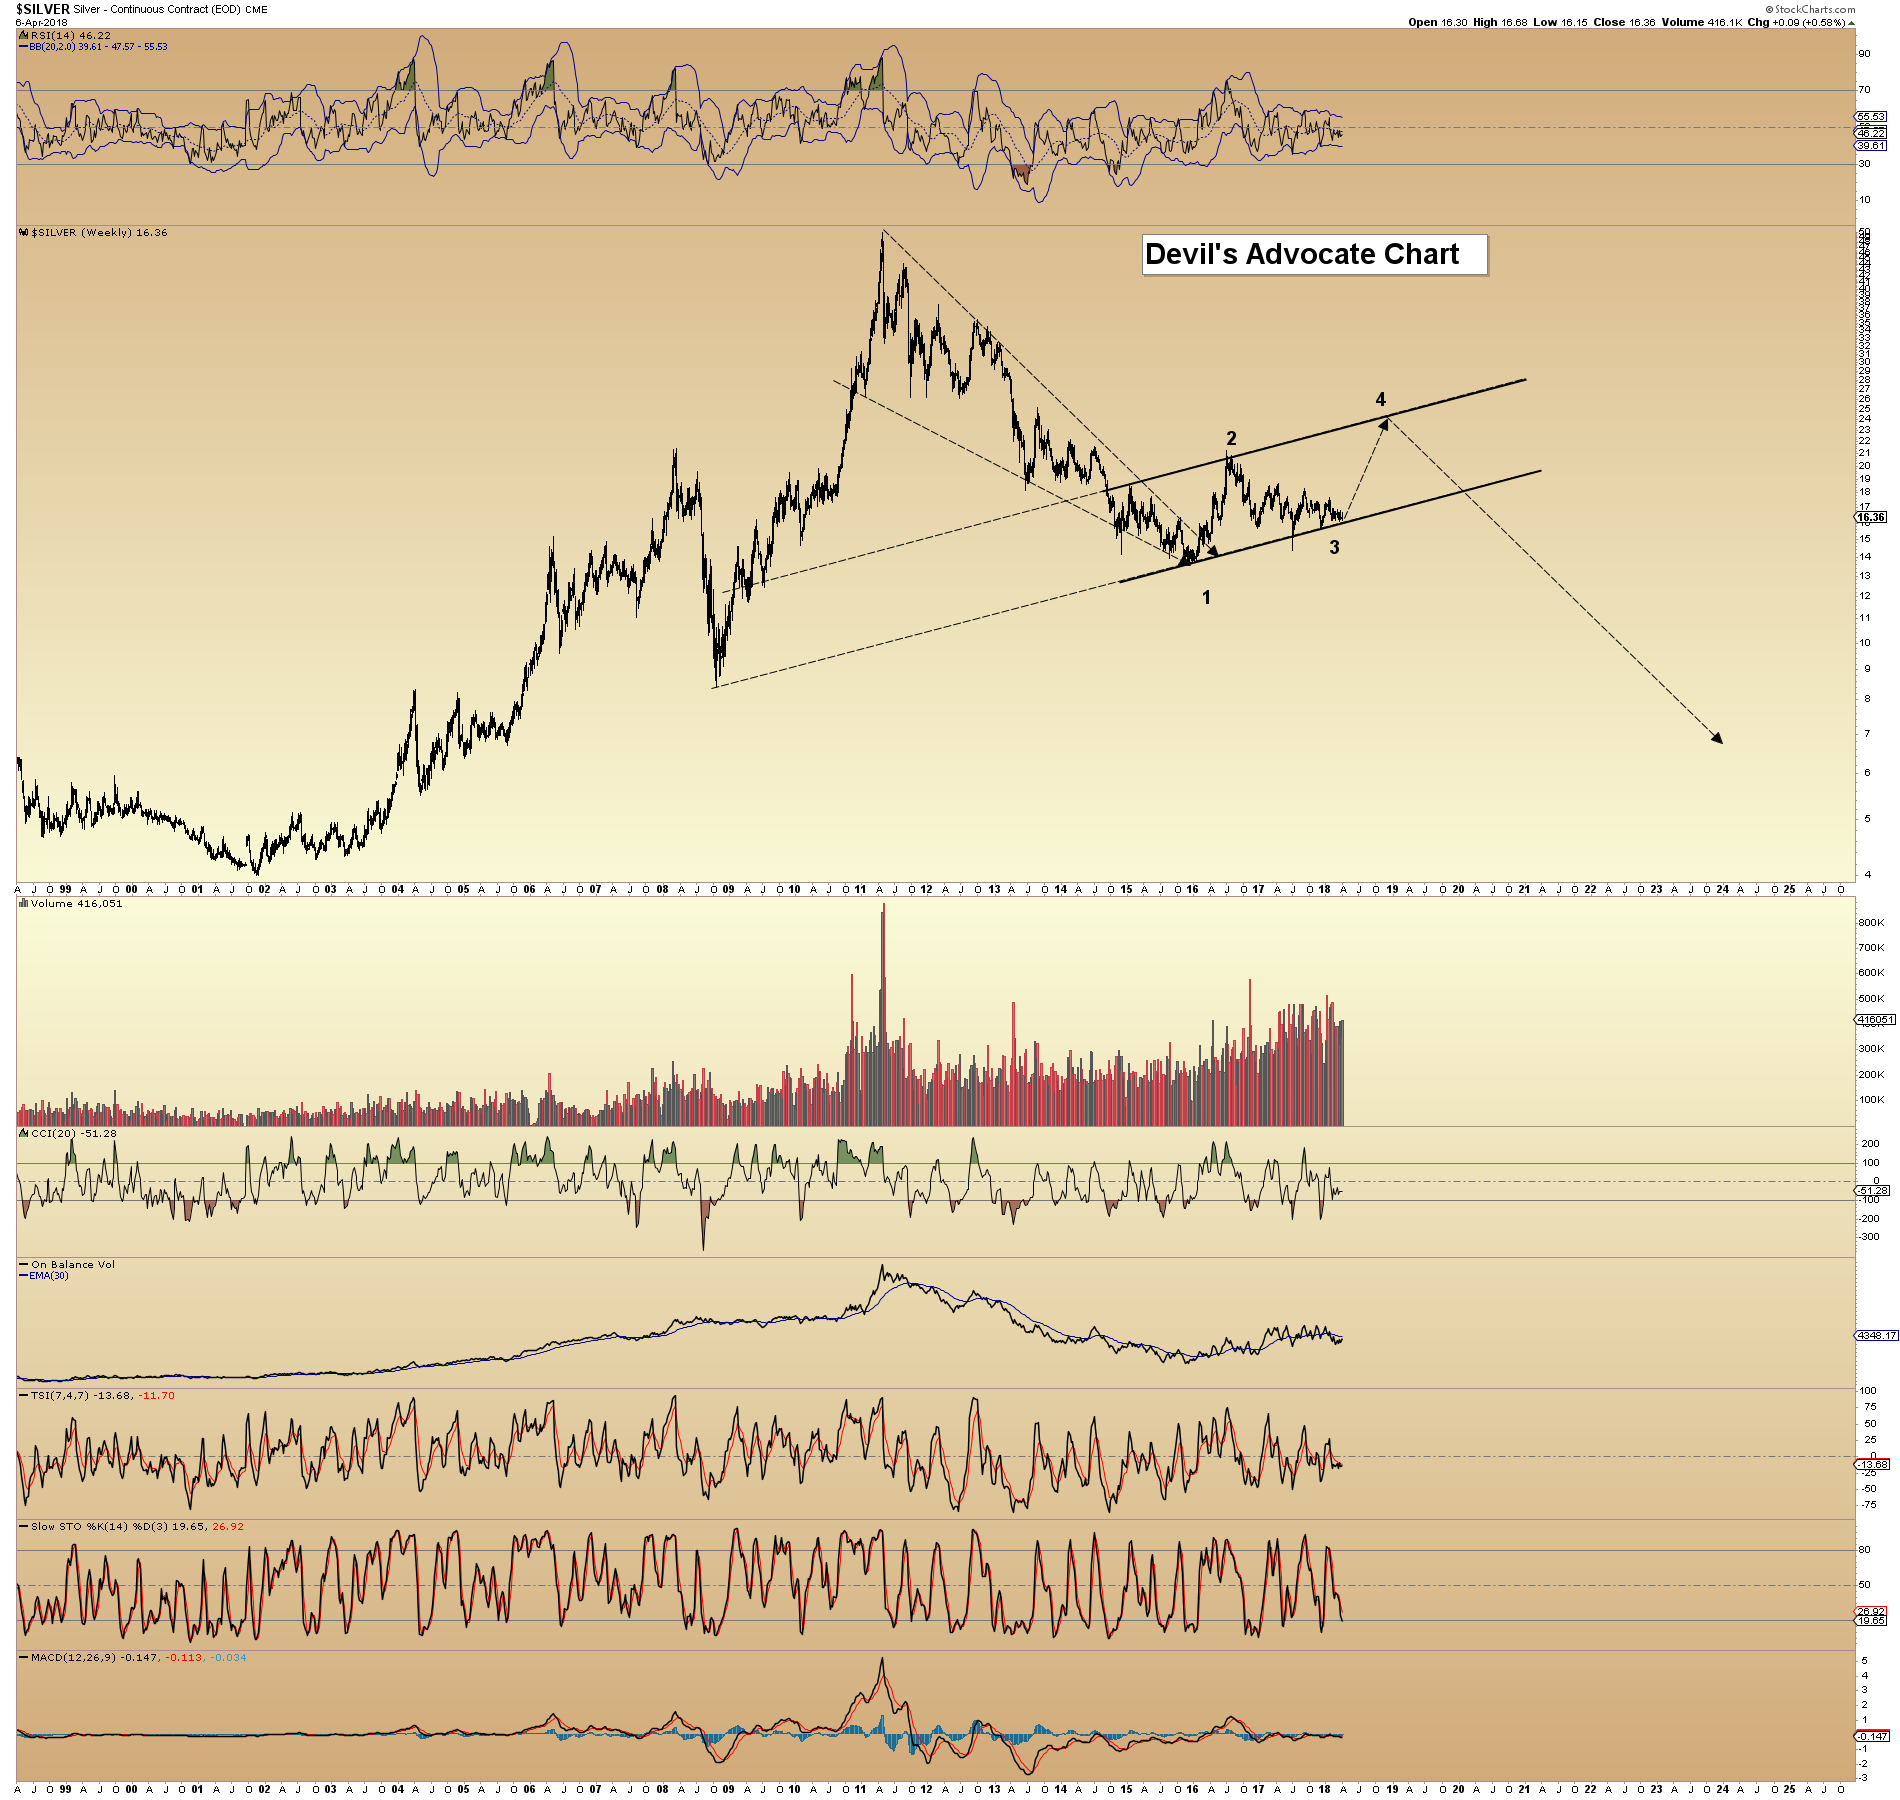
This first chart could be showing why the commercials are doing what they’re doing. There’s an interesting confluence of support there and from a symmetry standpoint there are some interesting hits as well, there is also a possible long term uptrend channel. The second chart is kind a sniper in the watchtower type. Just shows the important resistance created from the 1980 high and also why I believe silver has created a triangle where it has. The left side of a chart creates the right. And lastly, one for the bears just in case we don’t know everything.
Great charts, thanks for posting
Thanks Dave
Provocative work Sir Schism. As always !
Thanks Fully
Thanks Schism, the long term silver chart is great.
You might want to cross reference your last silver chart with this one:
https://goldtadise.com/?p=425068
Yes, that linear version is very crisp Jenks. That would make for a nice 80% move up to the 29-30 region running into November. Thanks
https://www.tradingview.com/x/aT00Isi8/
I’ve thought that could be a possibility. Then again, it almost seems too obvious a pattern.
We’ll see.
This was a great post I missed here. Very nice Schism!