Knock Your SOXS off
Rambus Chart and commentary today.
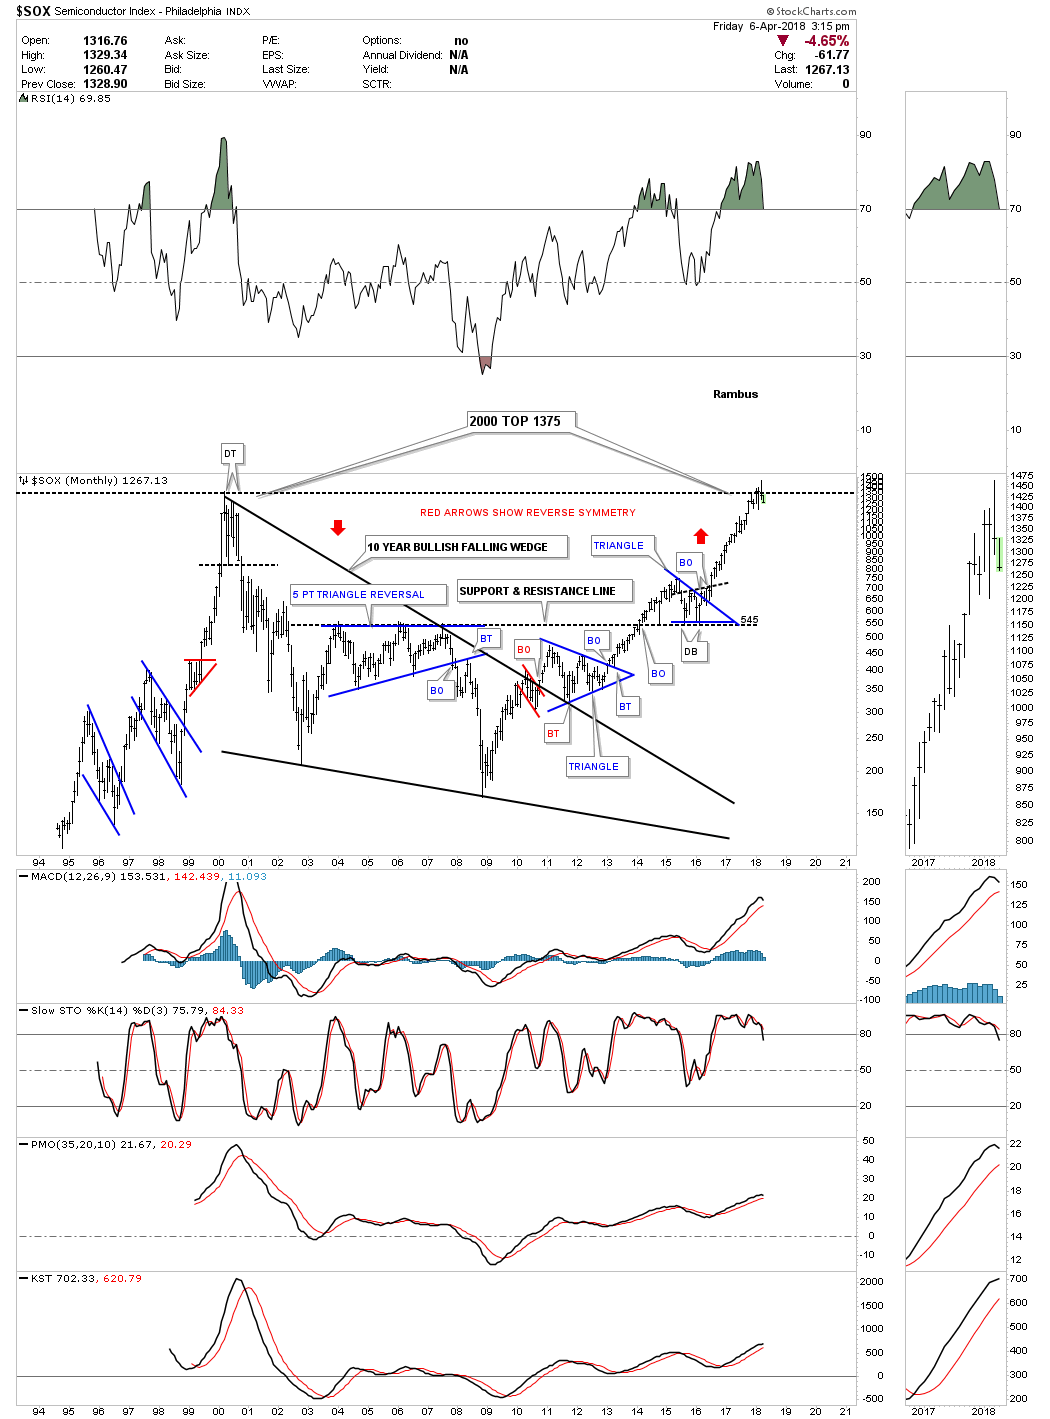
“Below is the very long term monthly chart for the $SOX semiconductor index which shows the price action finally reaching the all time high made back in 2000. Many times when an old high like that is reached there will be an automatic selloff as everyone and their brother see the same thing. How deep the reaction may go is still unknown.”
huge, el grande, muchismo divergento on weekly rsi amigo