Daily Chart Dump
You may have seen these charts before. Today is what I call a miniature repeat of the 2016 election: A capitulation on ultra-bear news. I believe today we ran out of bear fuel. Trump twitter storms, trade wars, AMZN wars, Immigrant wars…. at 5:00 AM EST today the sky was falling. The announcement of $50 billion in tariffs from China today was what I believe a sell (buy in this case) news event: all bad things are now priced in.
Remember that time we were down 1000 points overnight and then DJI rallied all the way to the previous day’s close and never went lower? I believe we are having the same scenario play out. I would have liked to have seen more volume… but still. It is remarkable that we were down some 500 points only to gain it all back and make huge daily hammers.
We have tapped on the the 200 Day SMA on this retest of the February lows multiple times in the past 2 weeks. For the NASDAQ 100 futures… today actually marked the FIRST time. This is important as the indices are basically “watching” each other to assure that every index completes the same major benchmarks. Sometimes you will see one index close the previous day’s gap… which tends to make the other 3 (out of SPX, DJI, NDX, RUT) close their gap as well. Sometimes you see an index break the previous day’s high or low… which makes other indices do the same.
The 200 Day SMA was struck by SPX500 futures back in February twice. It also struck the 55-day lowest close. The 55-day and 21-day (both fib numbers) lowest and highest close channels are special. The are VERY special. They have worked over the past 50 years on hourly, daily, weekly, monthly time frames. The best way to use them is watching for a pullback after trending for “some time”. They work in bearish or bullish markets (we are still in a bull market).
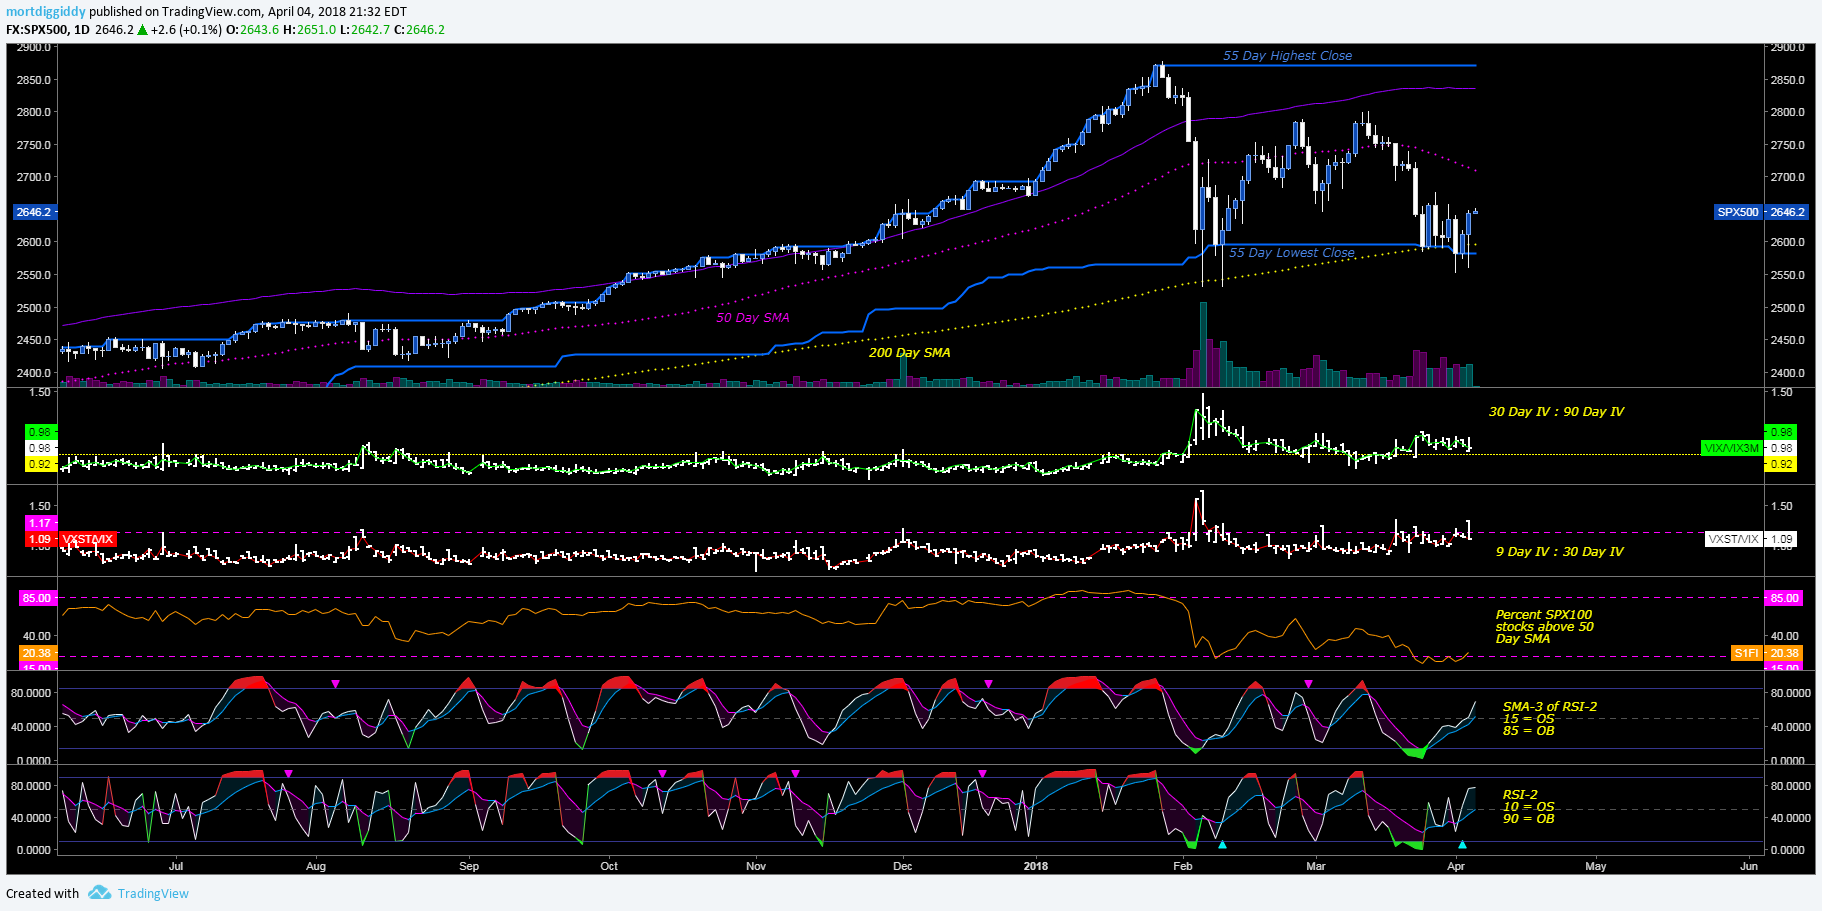
I have the same indicators on the first chart here as before. The key ones to look at are the middle, and the second from the bottom. I like the trajectory of the 2nd from bottom indicator (this from Larry Connors book, I implemented in code in Trading View). The middle indicator is showing something that doesn’t happen very often. We are literally stuck in oversold territory with the vast majority of stocks beneath the 50 Day SMA. Whenever you see something like this after spending so much time doing the exact opposite, it usually means at least one more “final wave” up is coming. Is it “the top” and do we make a giant bearish Gartley Pattern ? Who knows.
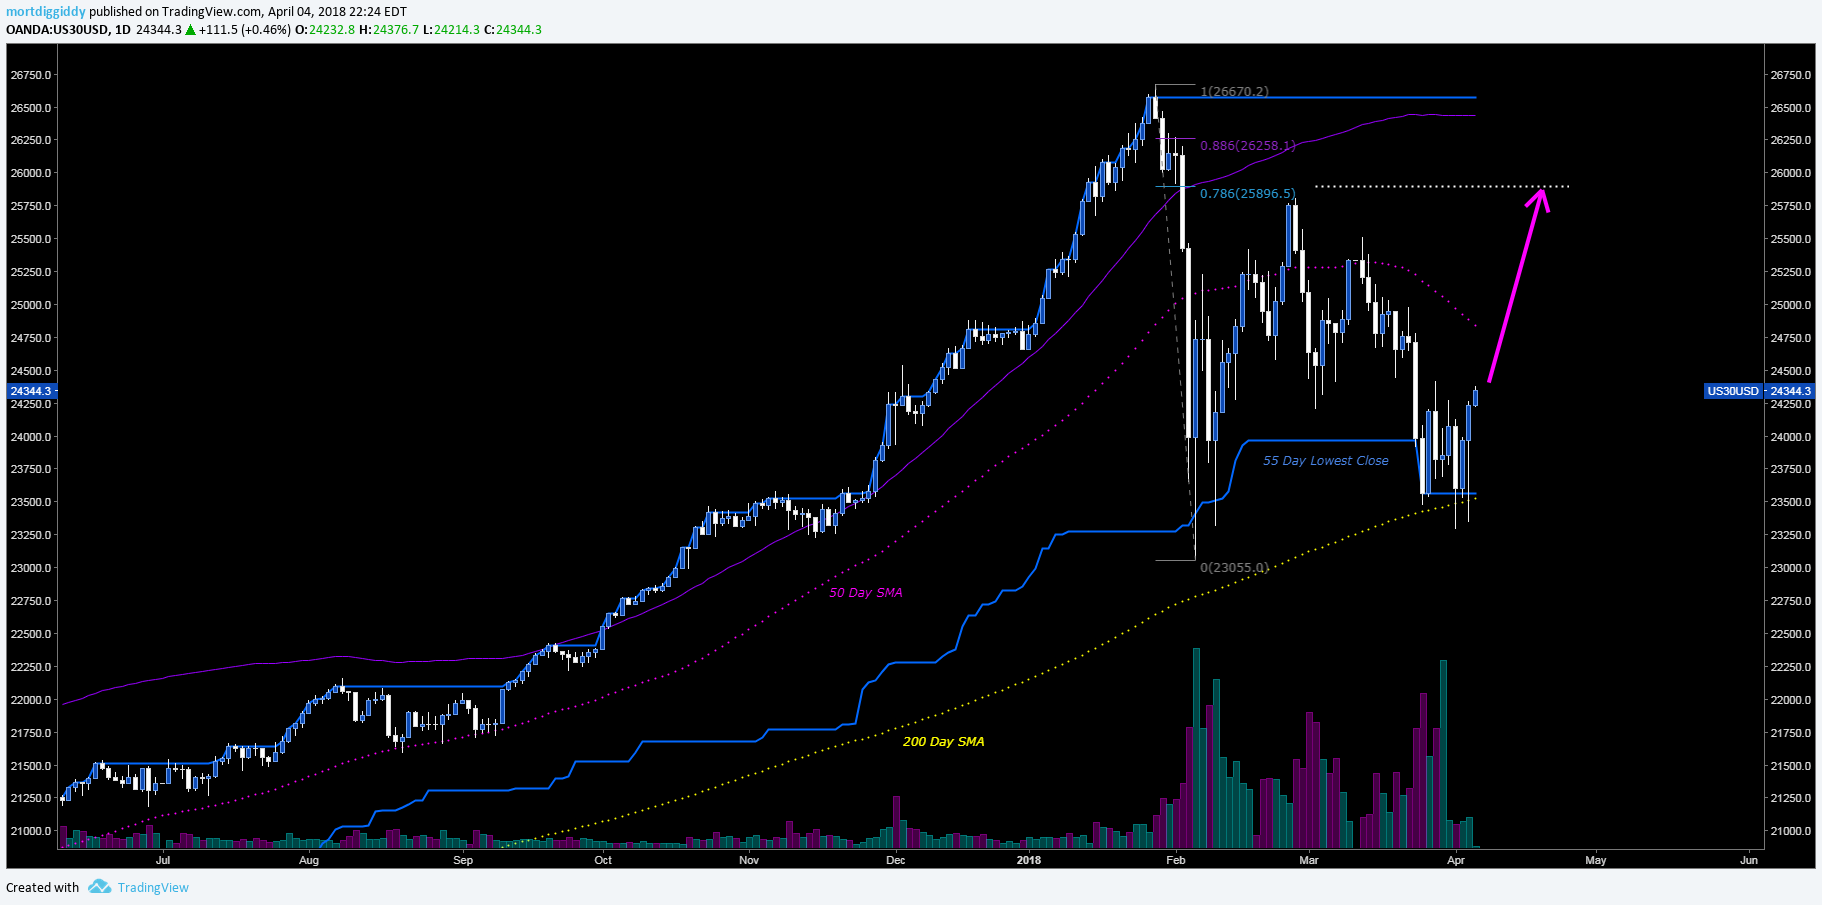
Next up is the Dow Jones Futures. We finally hit the 200 Day this week, twice. Today was another massive hammer bar. Notice again how the 55-day lowest close provides support multiple times.
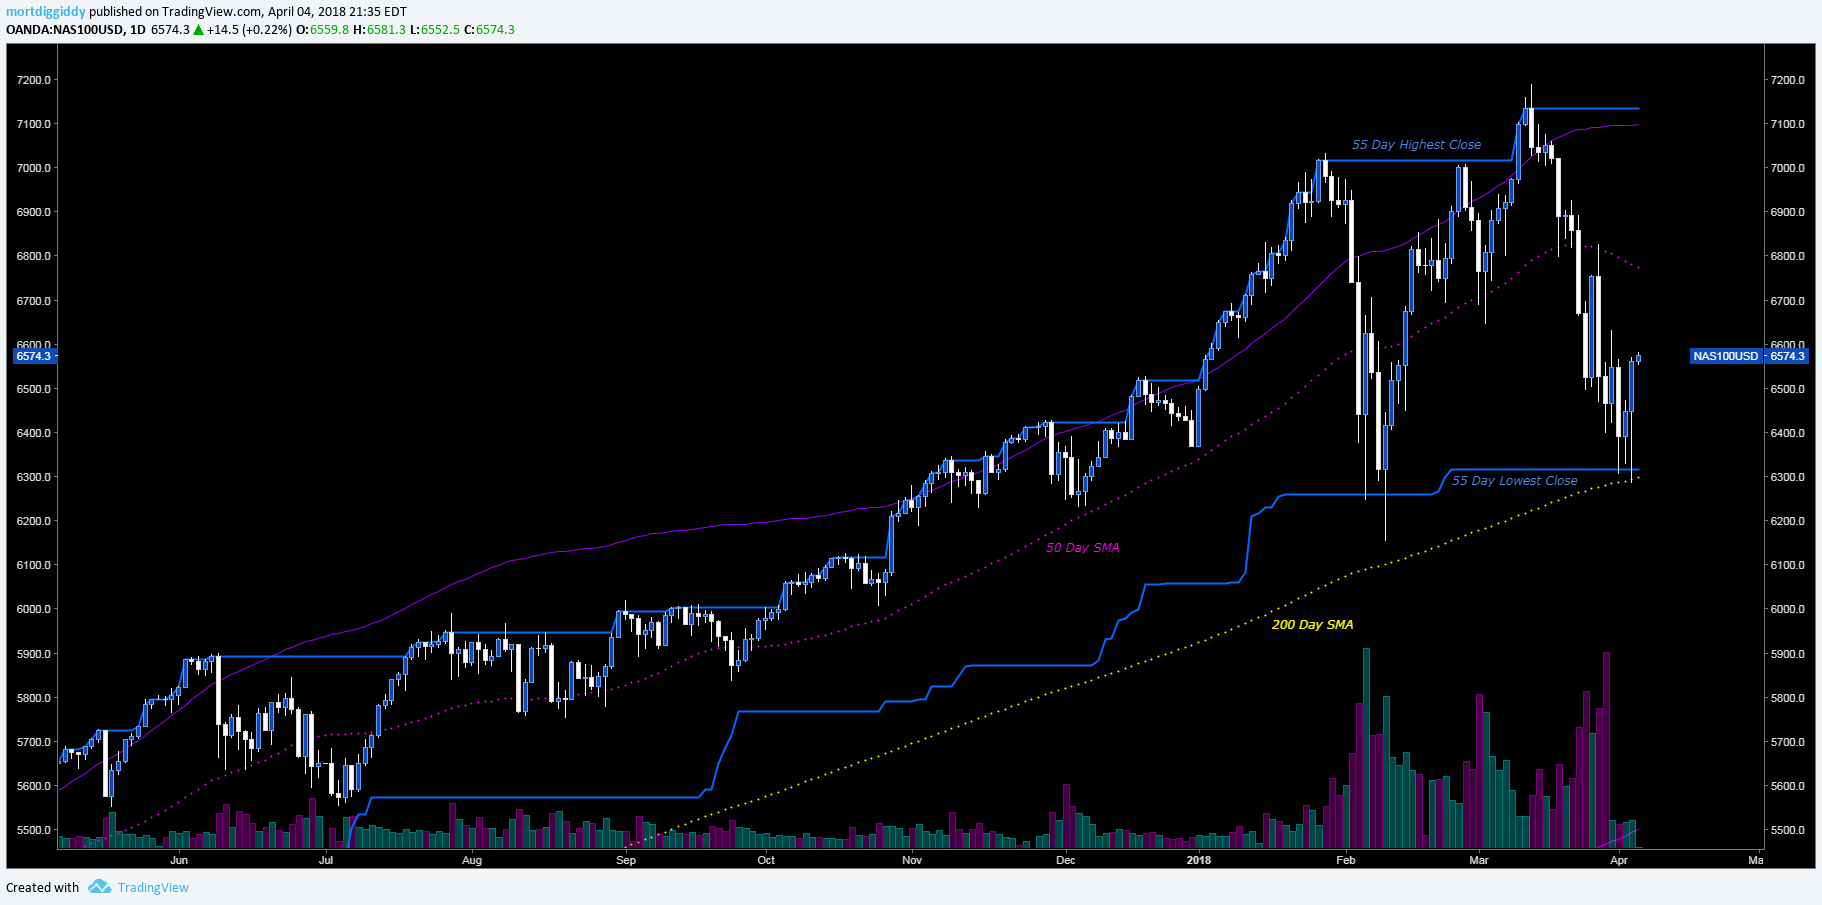
NASDAQ 100 Futures. Today we BARELY hit the 200 Day (yay). Again we found support on the 55-day lowest close.
The fact that we are having all around 200 Day strikes on the indices leads me to believe that we can move higher. The other reasons is that after this week we have managed to fill ALL of the remaining gaps that were generated on the way down since the top of January. There was a big gap left open on February 9th when all indices gapped higher. It took until late March to fill that gap.
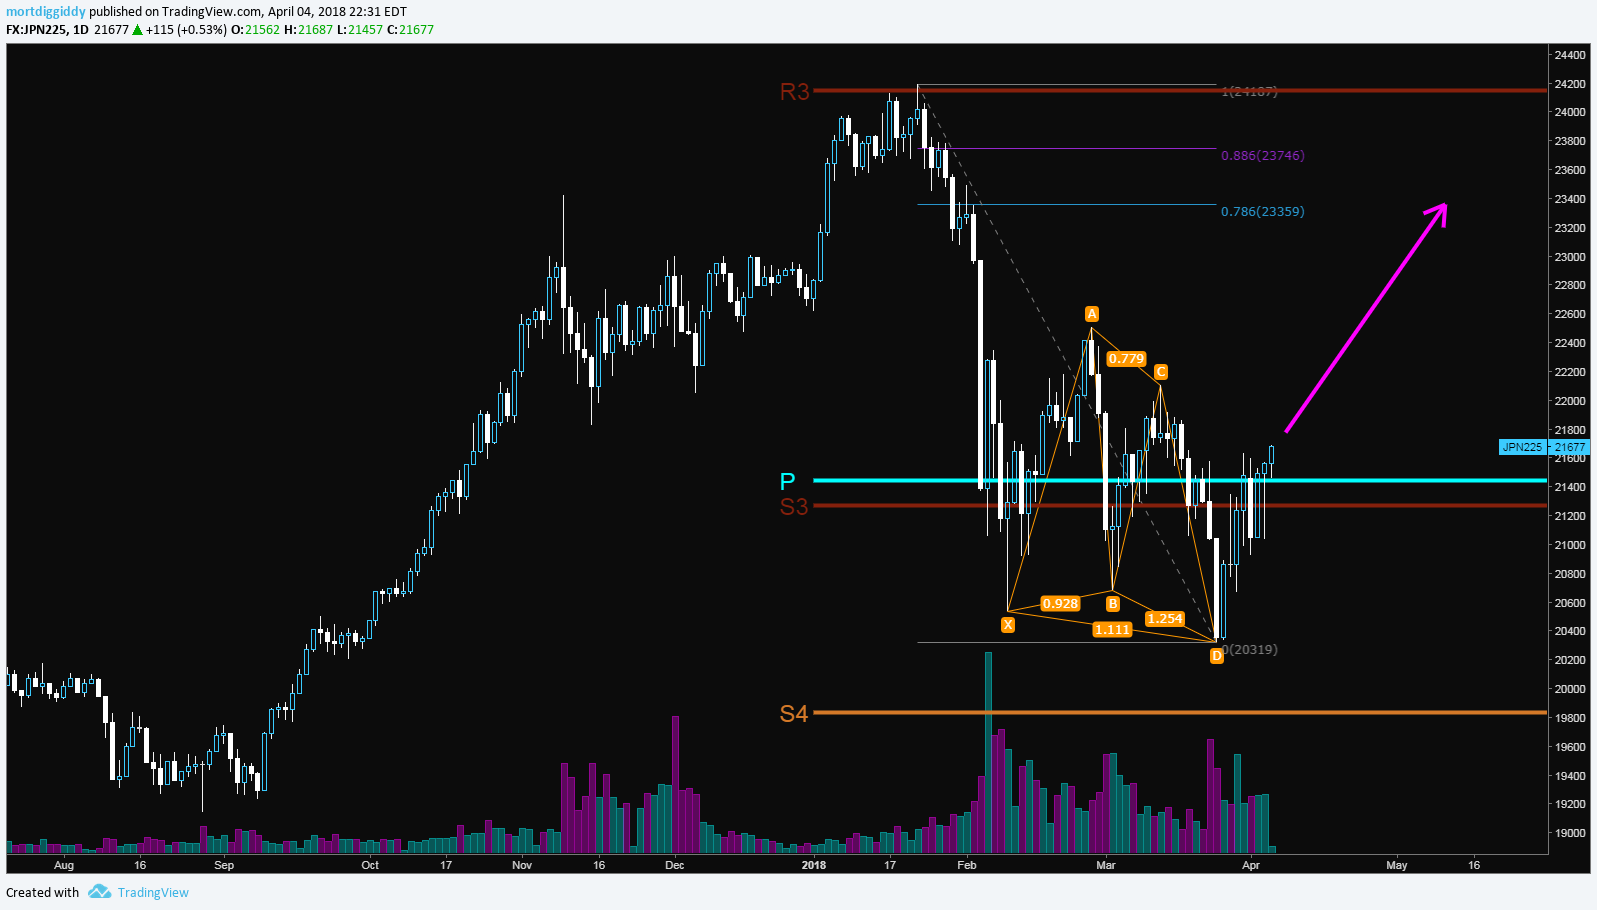
NIKKEI filled 12 day old gap today. Looks good as it retakes the year pivot (thick cyan line). I like the butterfly harmonic pattern bottom. Experience would suggest a 78.6% retracement here too.
I am hoping for tiny gap down tomorrow so that we leave no unfilled gaps. When that February 9th gap happened… even though the Dow Jones accelerated some 1000 points after in the coming days I was forced to believe we would revisit that location. Most gaps get filled eventually.
Bullish % SPX stocks are at August 2015 levels this week.
McClellan Oscillator showing a big bullish divergence compared to February lows.
Find the original post here.
Excellent Analysis Mort.
Thanks for posting this work.
You make a compelling case.