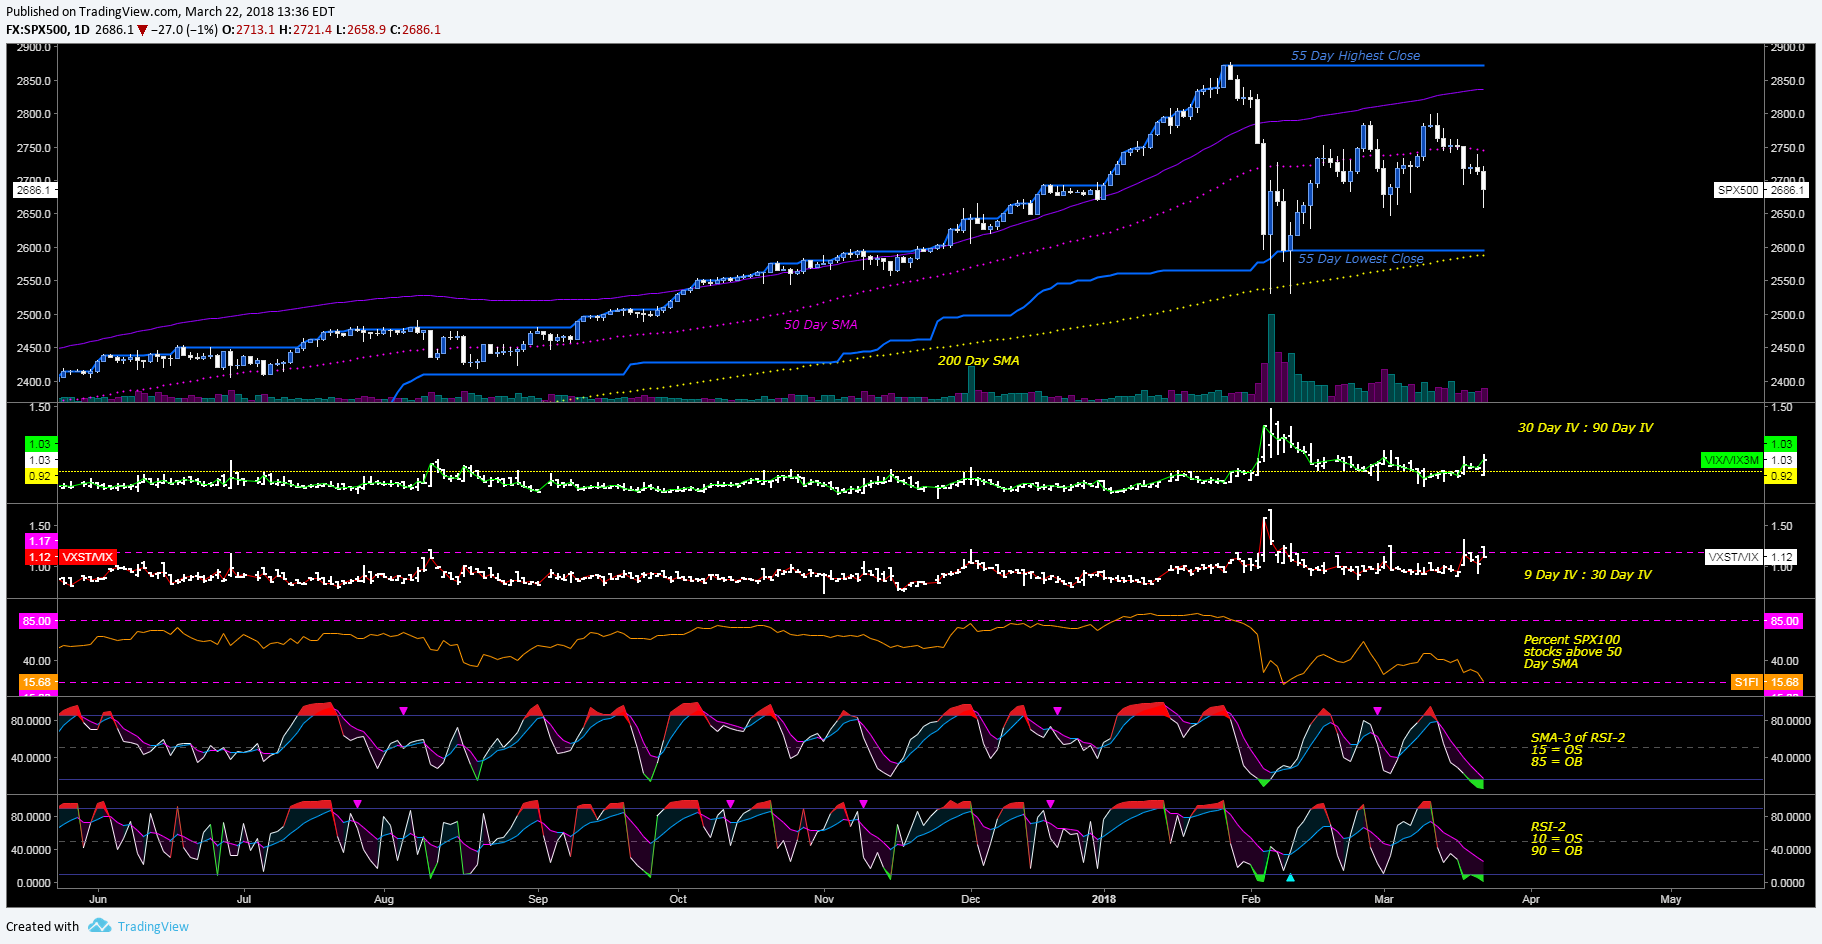
A bit oversold
Bottom 3 indicators showing an oversold condition. Volatility is at extremes again (top 2). We’ll see if we get some kind of relief rally. Since this is the third sharp leg down… we may just keep trending lower, who knows.
The middle indicator is usually associated with sharp bottoms once 15% or less of SPX100 stocks are beneath the 50 day SMA, we usually do not stay down there unlike bull trends which can be overbought for long periods.