Chart for you JL
What does gold do when stocks and bonds go south (and relative to the dollar) 1968-2013. I couldn’t find one with the USD included so just noted direction. I blew up the chart from the link below focusing on the fiat currency era. My guess is traders in PM stocks, probably won’t weather a collective downturn (2009) but a good chance of light at the end of the tunnel.
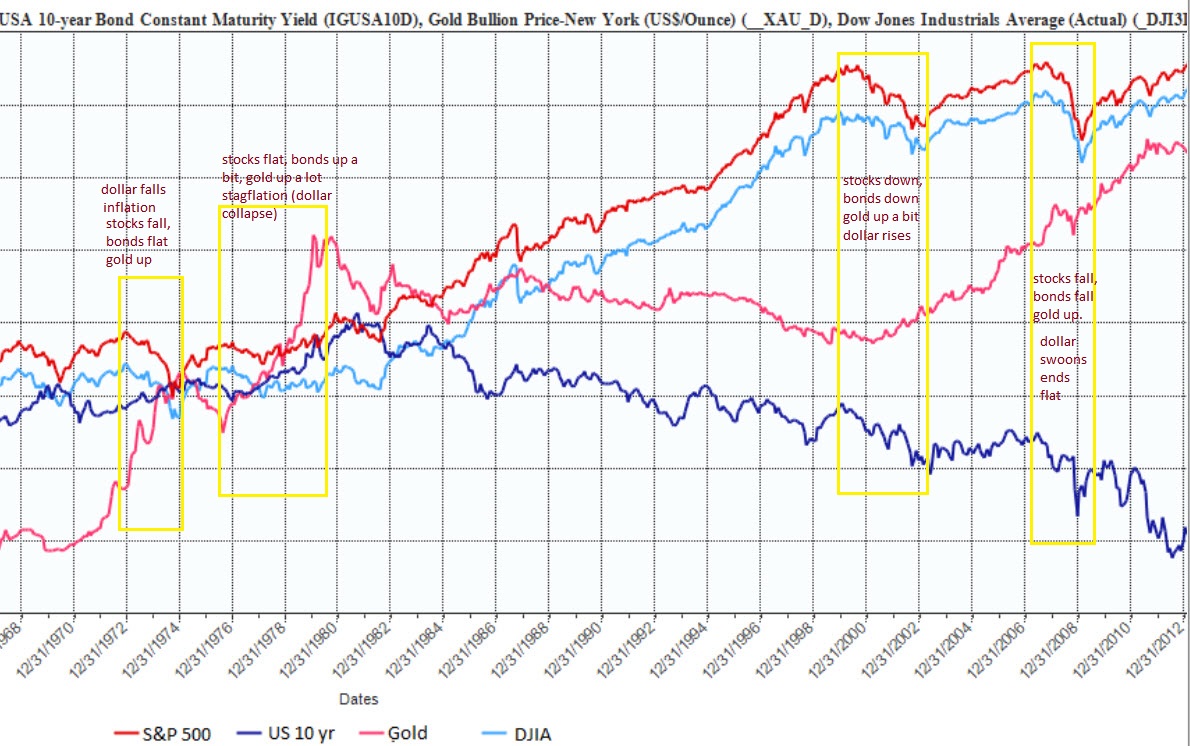
source
http://ritholtz.com/2013/06/sbg/
As a measure of sentiment (the ‘Miners’ concern you expressed), I couldn’t find a HUI comparison chart to include the yellow boxes above but relative to gold (macrotrends.com interactive chart), during 2000-2003 it was up against gold 300%. However mid ’07 to the bottom in ’09 it lost 50% against gold and then quickly recovered to only a 20% loss at the end of ’09, so as far as impact on miner stocks is concerned it’s hard to correlate. I’m sure someone else can provide a chart of what miners did during the two episodes in the ’70’s.
Questions for myself – Are CB’s going to keep the status quo for the next 5 years without going to NIRP (or other means of devaluing the USD – see my earlier GT post about the downward slope of the Fed Funds rate crisis ‘ceiling’ and running out of time)? are the odds of a war de-escalating or black swans events in general? are bonds reasonably priced vs risk outlook instead of mark-to-fantasy? are stocks reasonably priced – since my answer to these questions is pretty much NO, my belief is PM’s aren’t just going to peak up 50%, nor will the miners.
IMO investors today don’t price the following into trading, much talked about but not compared with in reference to LT charts. How the affects of Greed/Fear project into the markets at much faster speed of trading, saturation of mom & pop investors, leveraged speculators, predatory traders, algo trading, institutional movements (slow and lathargic) and now the bottomless pockets of CB’s….
Are LT charts, trends and comparisons predictable as in the past or have they morphed?
Thanks YYZ. I suppose I’m coming at things from a TA point of view, rather than anything particularly historic. IMHO, bonds looks ripe to dump, which I think will be one of the causes of SM’s dumping too.
My hypothesis is really $SPX falls 20% quite quickly, e.g. in the space of less than 2 months, probably in two 10% falls, one after the other. As of now, I’m thinking double top. If this does happen, it will be a mini panic. I also think it will be global, meaning pretty much all SM’s will fall this much. Bonds will also dump significantly whilst this is happening. I think the dollar will rally whilst this occurs but I don’t understand why. For me, I noted potential bullish divergence between MACD and price on $USD’s weekly chart some weeks ago, so I’ve just been working from that. It’s a theory, largely derived from TA, if that makes any sense.