When Will it End?
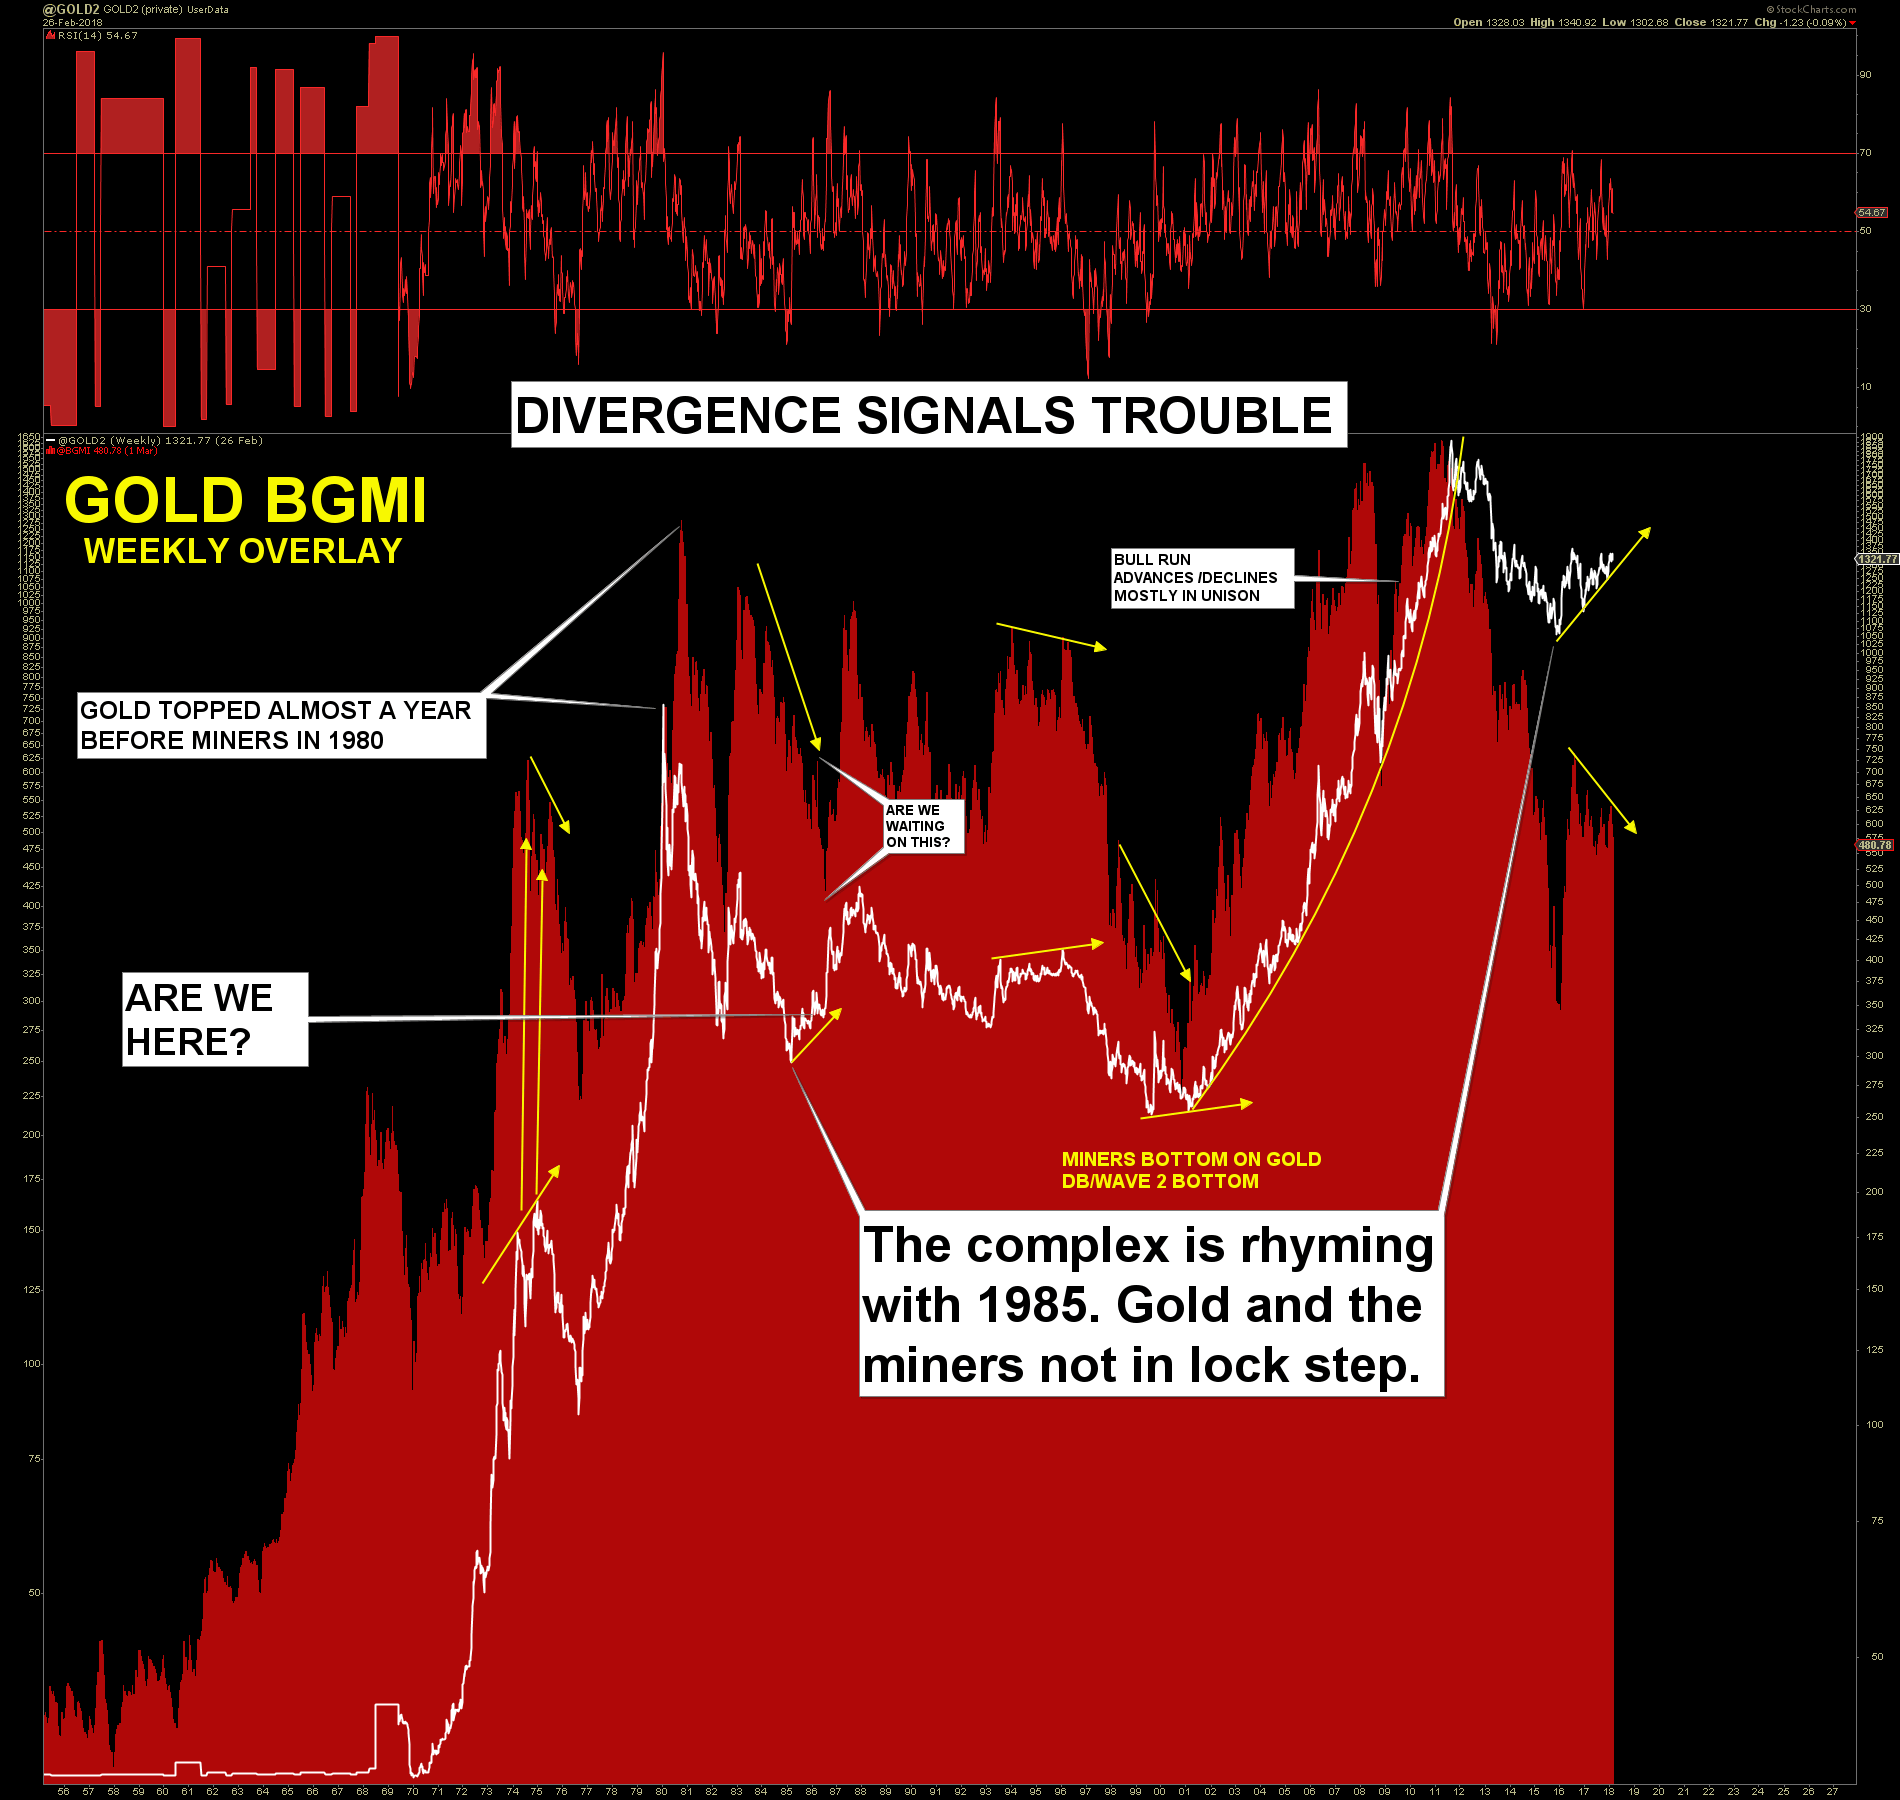
The divergence we are currently enduring between gold and the miners has generally signaled only one thing and that is that the miners are sick and need to puke. The current situation looks a lot like 1985 where Gold maintained a nice uptrend but the miners could never get traction and continued to slide for months on end. When the bull is healthy there’s very little divergence between the two.
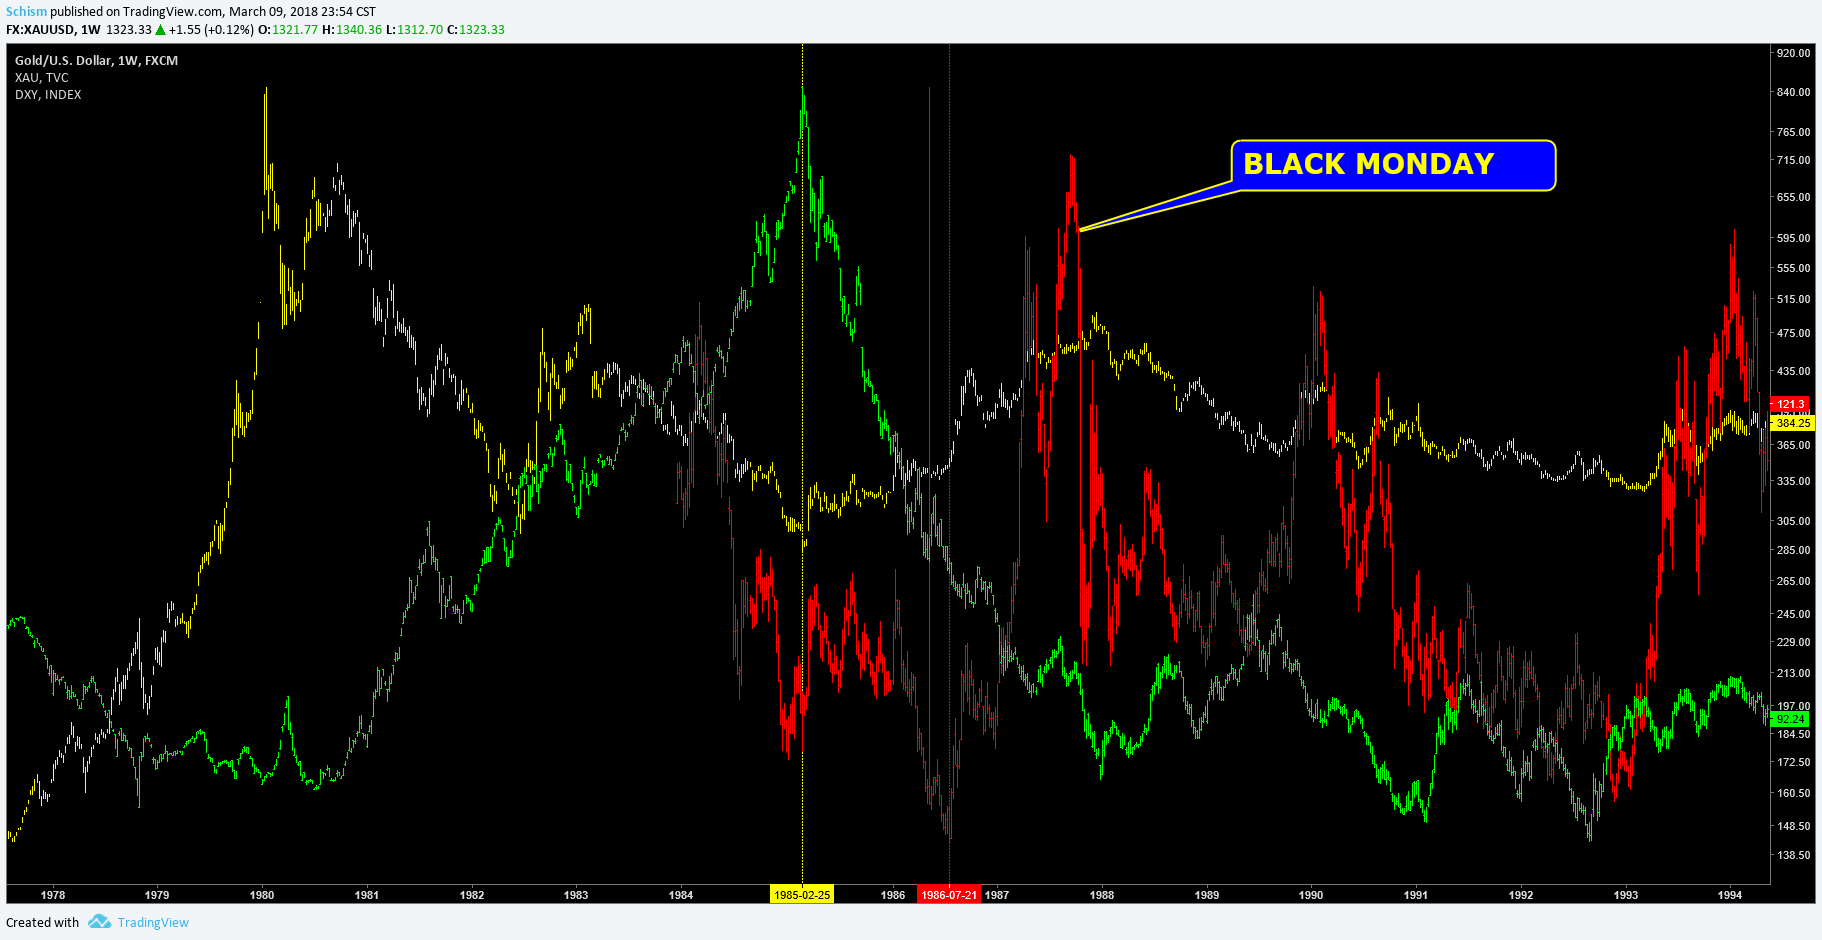
You can see here in the XAU/Gold/USD chart from 1985 how lethargic the miners were in what appeared to be perfect conditions.
Dollar Tanking-Check
Gold uptrend-Check
Miners-shitting the bed
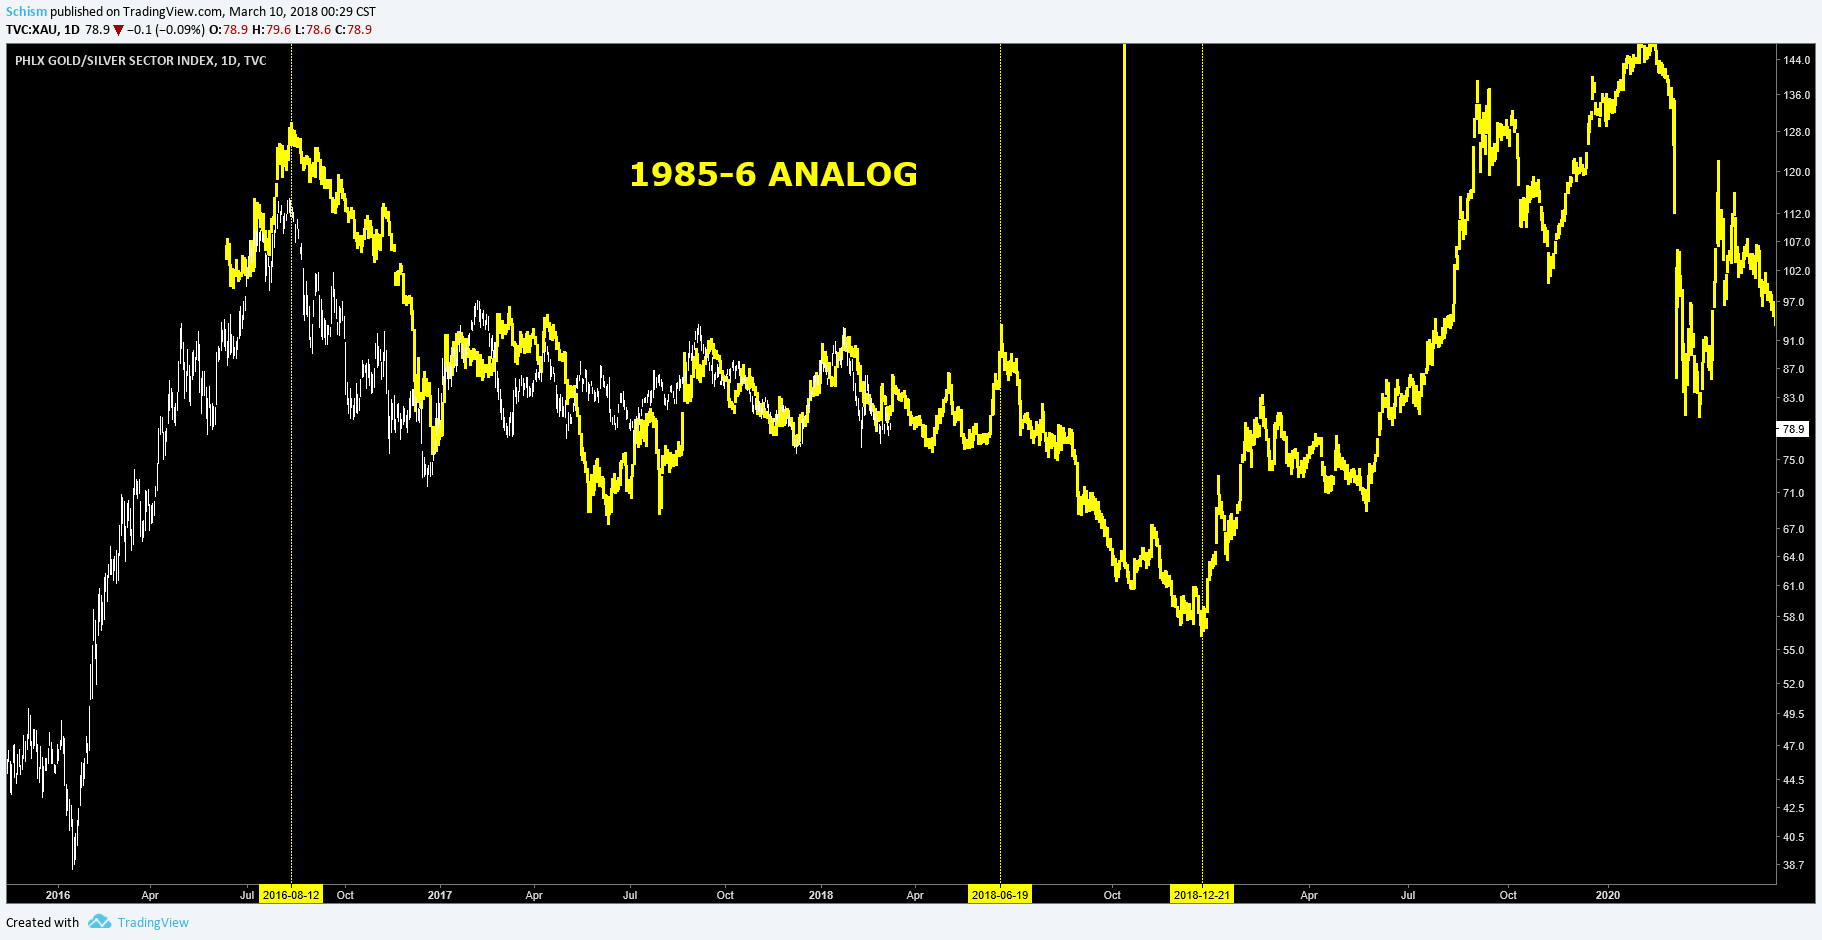
This chart is the 1985 XAU analog overlay on today’s chart. While not perfect as it has an inversion or two it fits nicely. I was actually amazed at how it fit with the fibonacci dates of interest I have coming up. That looks something like this-
April 16th-low
May 1st-high
June 19th-the yearly high
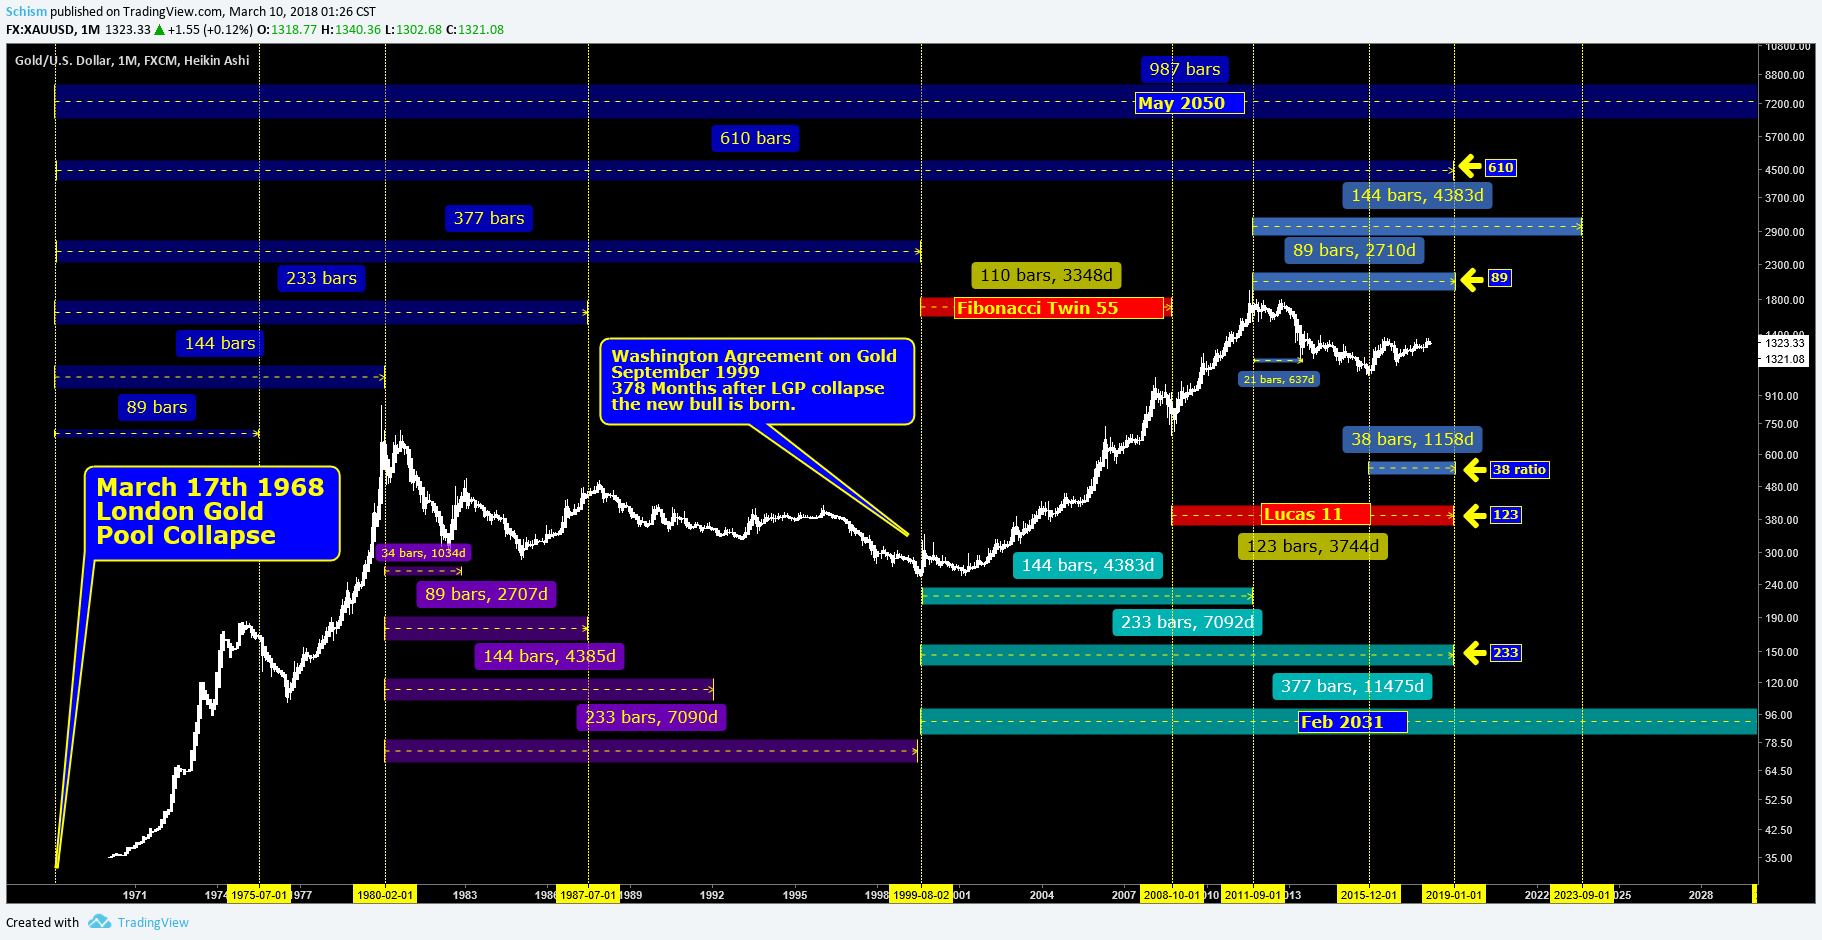
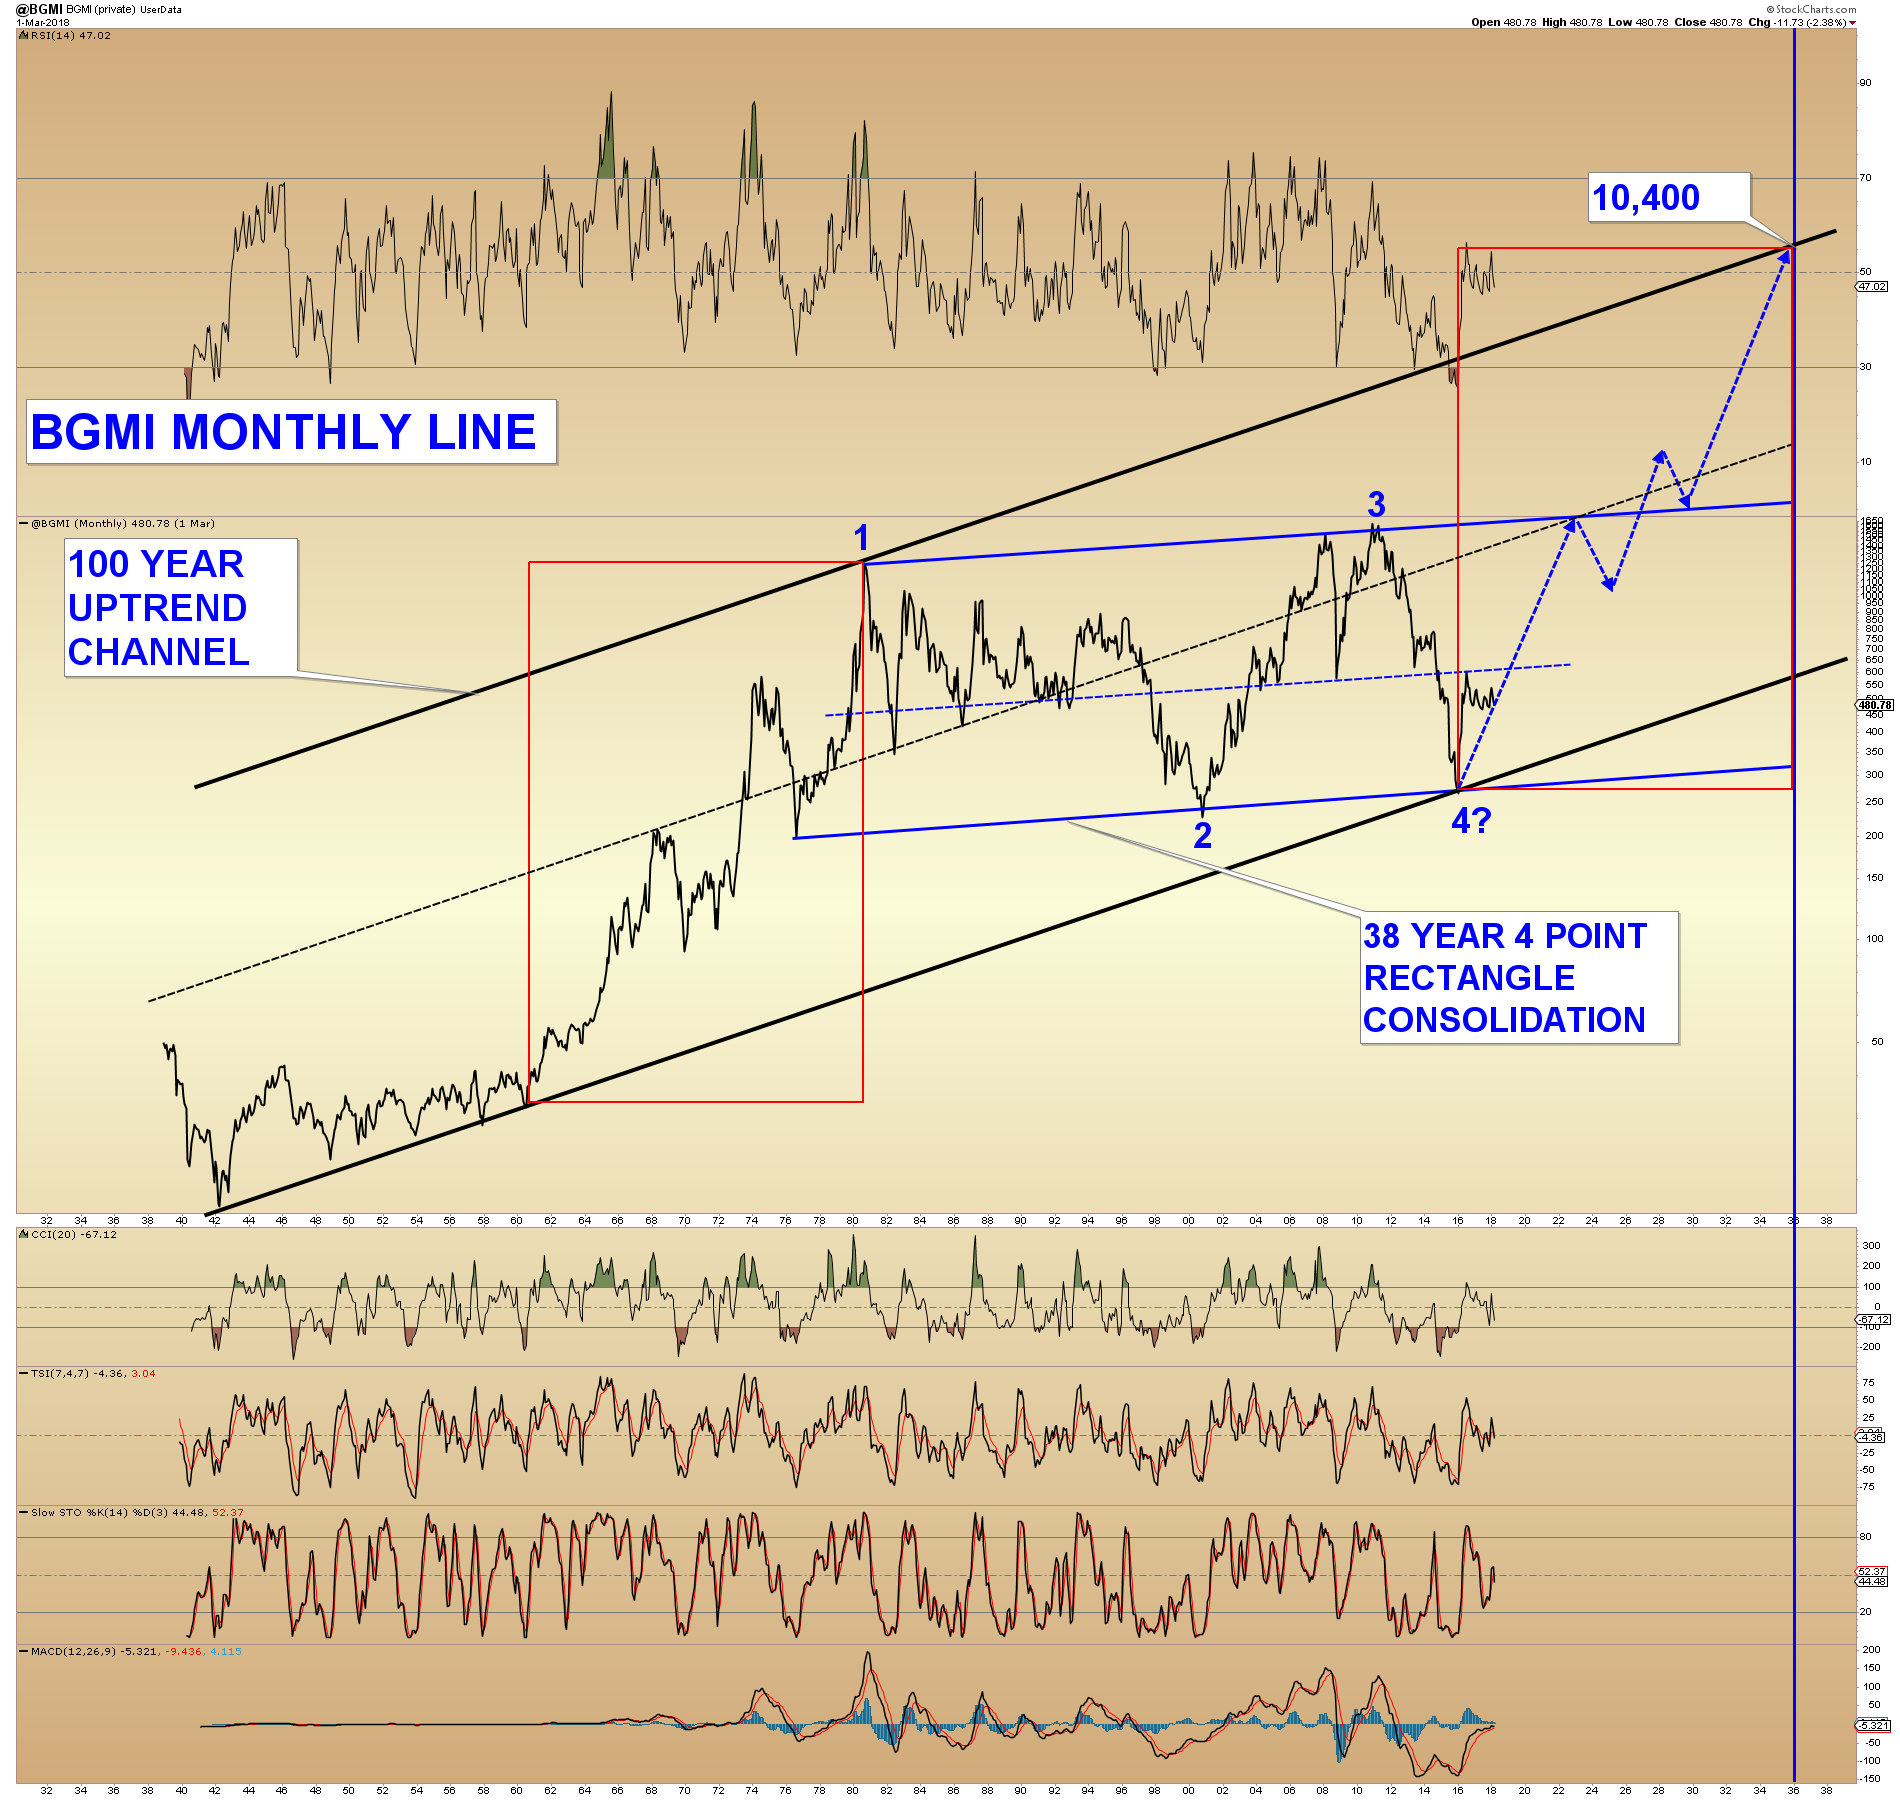
I have been looking at everything through the lens that it would tie into this next chart. It is a monthly Fibonacci count that I put together a couple years ago.Which if gold is long term bullish it would probably mean declining commodities in the second half of the year. Or on the flip side if Gold bullishly rose into this time zone I would be nervous for the long term prospects. 50 years of time is culminating at the beginning of 2019. Even for people that think Fibonacci is bullshit have to at least appreciate the beauty of the synchronicity. Maybe beautiful things unfold from that time.
Obviously I hope that the 1985 correlation is temporary and that this is the final shake out before a sustained bull market. Beyond pure speculation at this point but I like the dream.
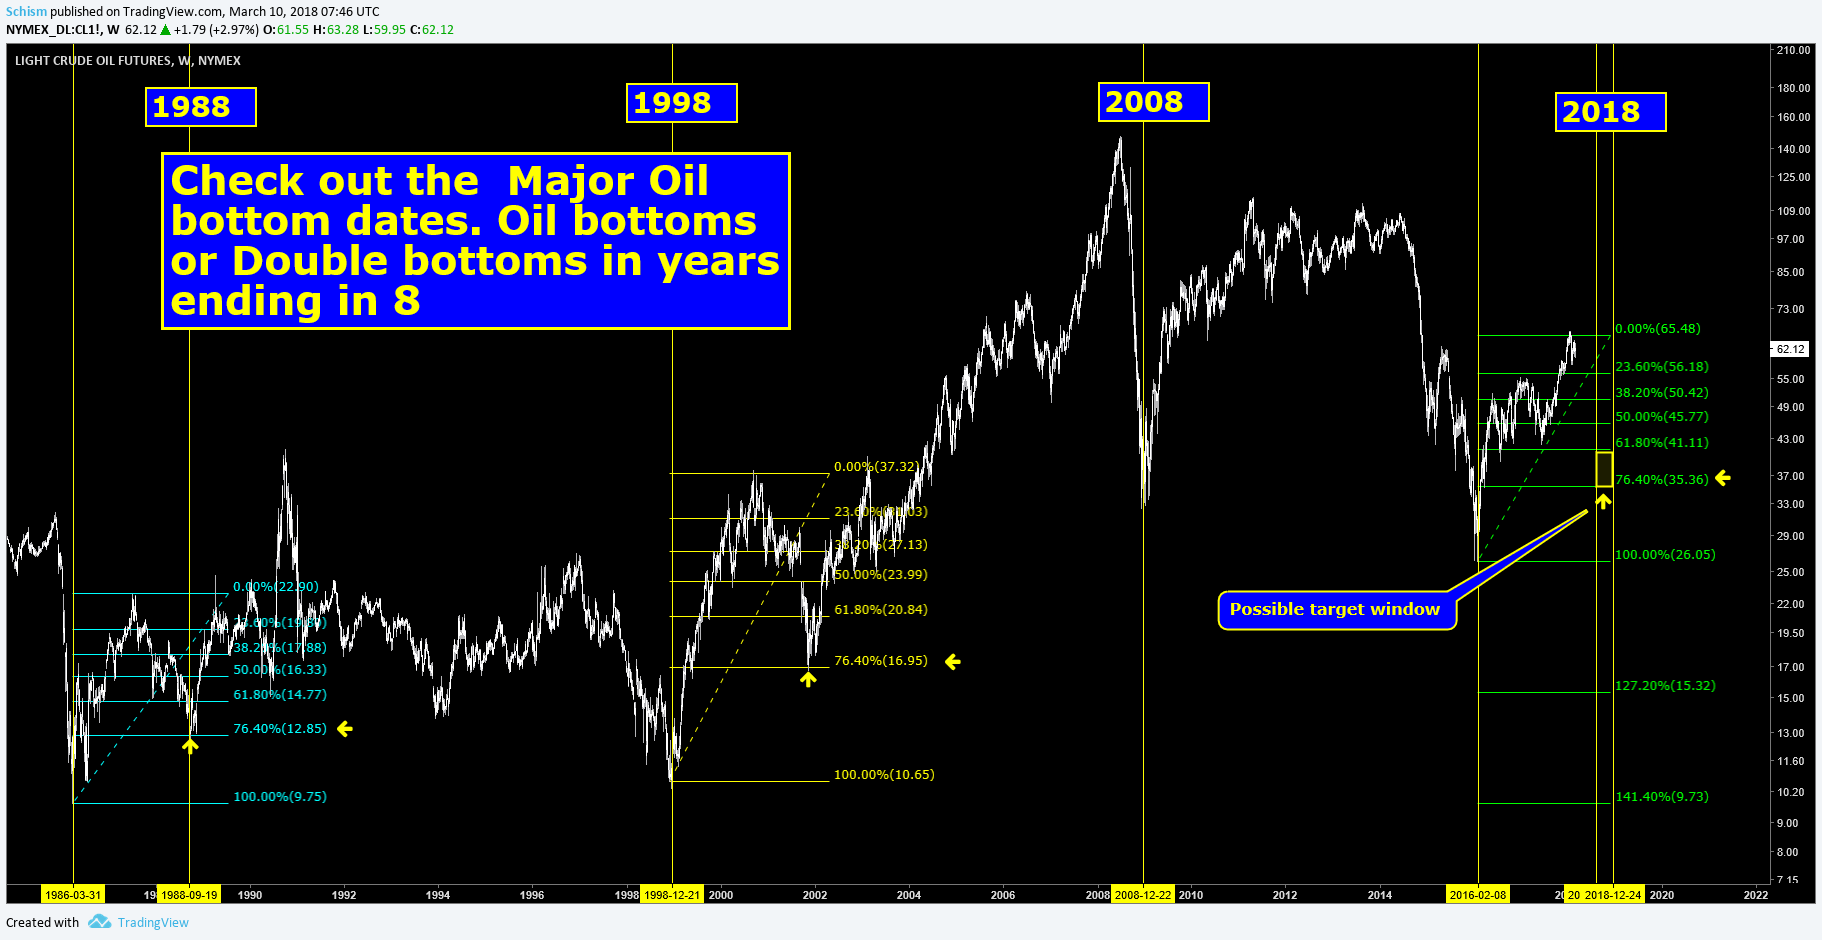
This last bit of speculative evidence that commodities could be heading down after June is the Oil chart I’ve shown before. It shows how Oil follows a nice 10 year schedule of major lows or wave 2 secondary lows bottoming in years that end in 8. Well, here we are. Oil COT is still ridiculous. Quandl data is currently missing on tradingview or I’d show the historical imbalance in that number.
I was hoping to see gold at 1433 and gdx at 31 by June but obviously not sure if it gets that high. Analog shows more of a 25-26 PO.
Thanks for checking out my current stream of consciousness. Just something to keep in mind going into a June rally.
I should mention that this certainly isn’t a perfect theory and June could be a major low but I’m currently leaning for a high but will adjust if needed.
Apologies for lengthy post.
Great post and plenty to think about. Thanks Schism.
Thanks. It is a week end read and reread.
Thanks for checking it out and commenting NS and MM. Appreciate it
Wow !
What apiece of Work Sir Schiz
Brilliant out of the box thinking.
We cannot rule out the long term fractal….I have been looking at that 1980 top and 2011 top as 2 parabolic runs as well
However that BGMI Chart with the perfect Chartology on it is My favorite ! That’s a beauty . Thanks for sharing this….going back to re read
I certainly haven’t discounted it fully. Especially because of the time component where now and the fractal could have similar run to a long term high around the 89th month. This is why i’m hoping for a deep low into that zone as I believe that would in turn be a launch point when reviewed in the future. It takes time for all these things to get in sync.
Thank you – a couple of ‘up’ weeks ahead and then let the puking begin! (I actually believe we have entered into an ending diagonal in the miners so quick pukes followed by equally quick and strong ‘hope’ rallies, until all hope disappears)
I think you’re right Patty. This is morbid but the miners are analogous to a drowning victim until proven otherwise. To me the analog is predicting no rate hikes…shall see. Thanks for the comments
a work of genius may be overstating but not by much
Hey Thanks, I appreciate that but I can assure you there’s no genius here.
Great theme Schism
Sense the underlying tone to the 80’s. Question for you Schism you have Oil in 88 and Gold in 85?
Have a look at the $Copper:$Gold ratio from this era it is interesting IMO with respect to your comment regarding commodities.
The DXY drop Gold/PM’s action of the 80’s is definitely a head scratcher whenever someone throws up a $US chart.
Thanks for your post Schism
Thanks Red, I would say the Oil chart is more fractal and cycle in nature than an analog of a specific time period. Was thinking everything will get kind of funneled into the Jan 2019 zone. I almost posted a copper too chart as its sitting on major resistance as well. I will check out the copper gold ratio in a bit…gotta take kiddo to karate. Thanks for heads up
Outstanding piece of work, Schism. It helps make sense of this browbeating market. I really do think you nailed.
Much appreciated. Thanks for sharing.
Nice!