$Gold – Daily
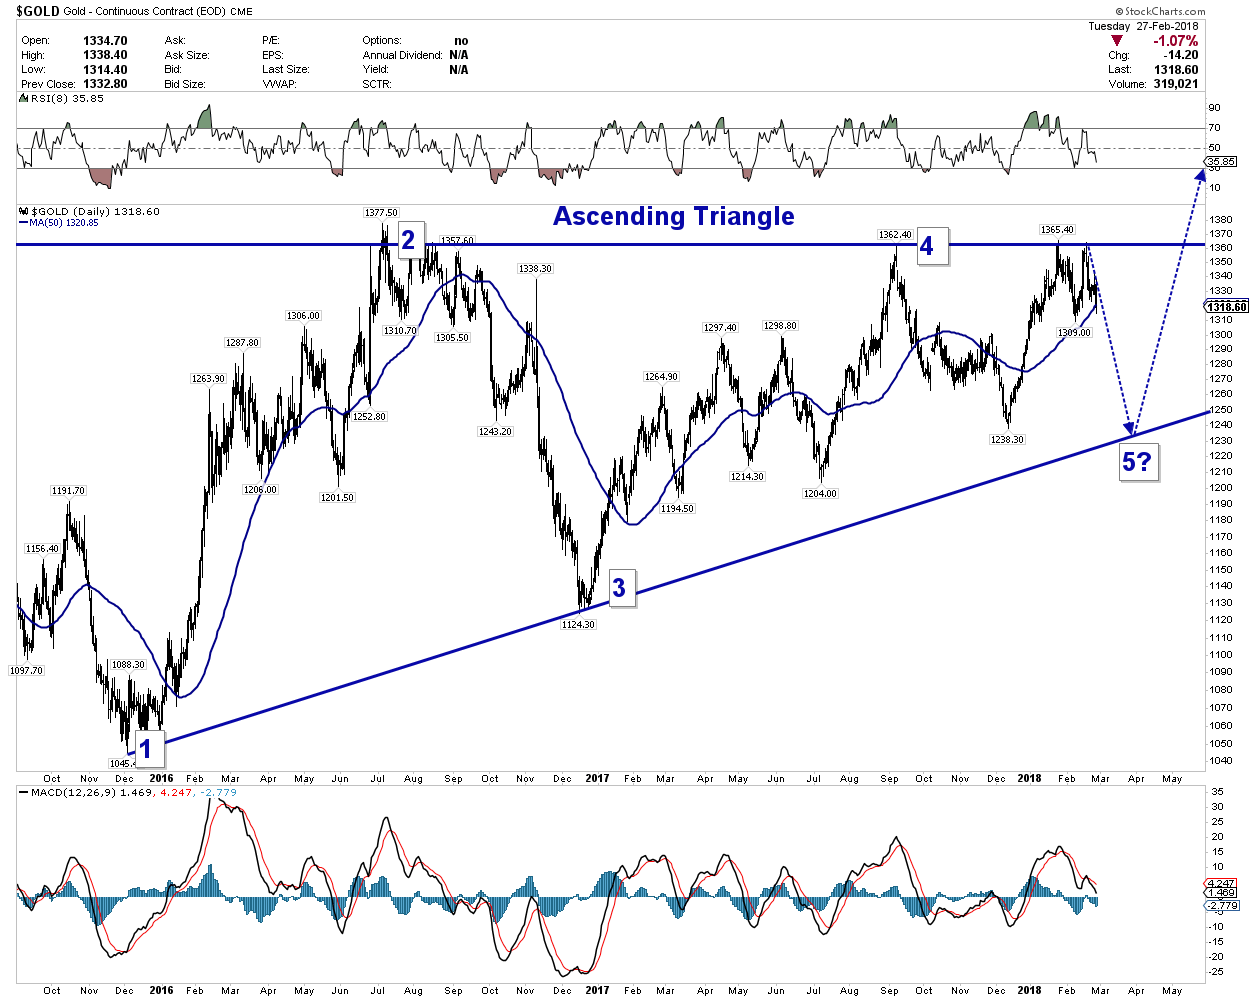
On the other hand, its entirely possible that since late 2015, Gold has been carving out what appears to be a bullish Ascending Triangle pattern – the underlying trader psychology being that as sellers continue to cap the price at the same price level, buyers continue to step in at ever increasing prices, absorbing overhead supply with each successive attack on the upper rail. The progressively higher lows – or eager buyers – eventually overtake supply with an upside breakout, to complete the bullish pattern.
From a “chartology” standpoint, however – that would indicate a trip to the lower rail is in order to set up a 5-pt (bullish) reversal pattern – that is, if the AT pattern is operating.
Looks very plausible RTV this would be the Catalyst for Rambus’ potential 120 HUI projection .
Good chart !
great clear logic – thank you
I see the same ascending triangle. In another era I would think it was ready to soar. Problem is, I’m watching this very closely, and it looks like we are going to get a recession signal this year: https://fred.stlouisfed.org/graph/?id=DGS10,DGS1, as the 10 year starts to fall while the 1 year continues up. Deflation is in the cards.