SOX
Is, I think, either:
a) Building out a H&S
or
b) Building out an expanding triangle.

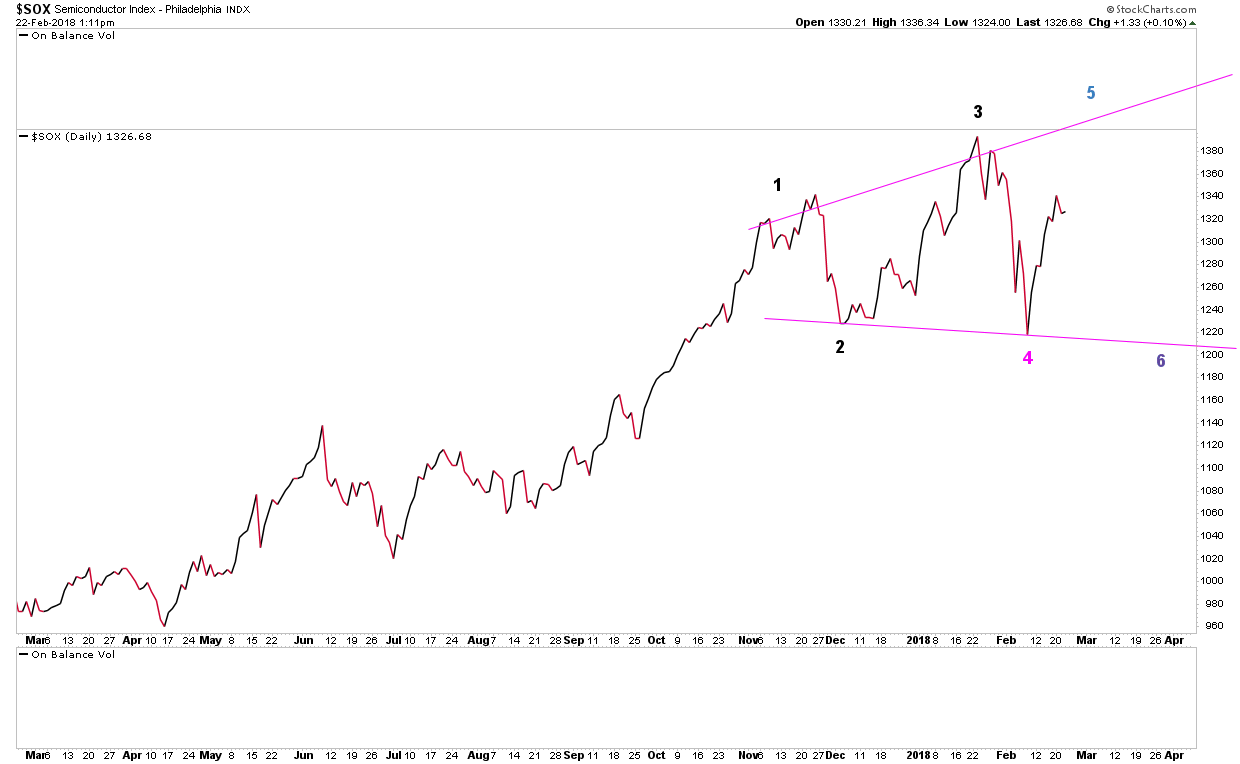
As of now, I think b is most likely. Rally continues up to a new high, point 5 on 2nd chart, then declines to point 6.
*If* this scenario occurs, question then would be whether price starts building out another reversal point at 6 or continues its
decline. Also, a new high at 5 combined with continued bearish divergence on chart 1 between price, RSI & MACD would make it
*highly* probable price is going to fall back to point 6 IMHO.
[Edit: Potential “Full House” of bearish divergences building out on the weekly]:

This would play out with a bullish move for the next 2-3 weeks before the grand finale down…
Think it may be only a week, or just over, before this thing tops out.
Thank you for the nice work Jenkins.