$SPX Charts
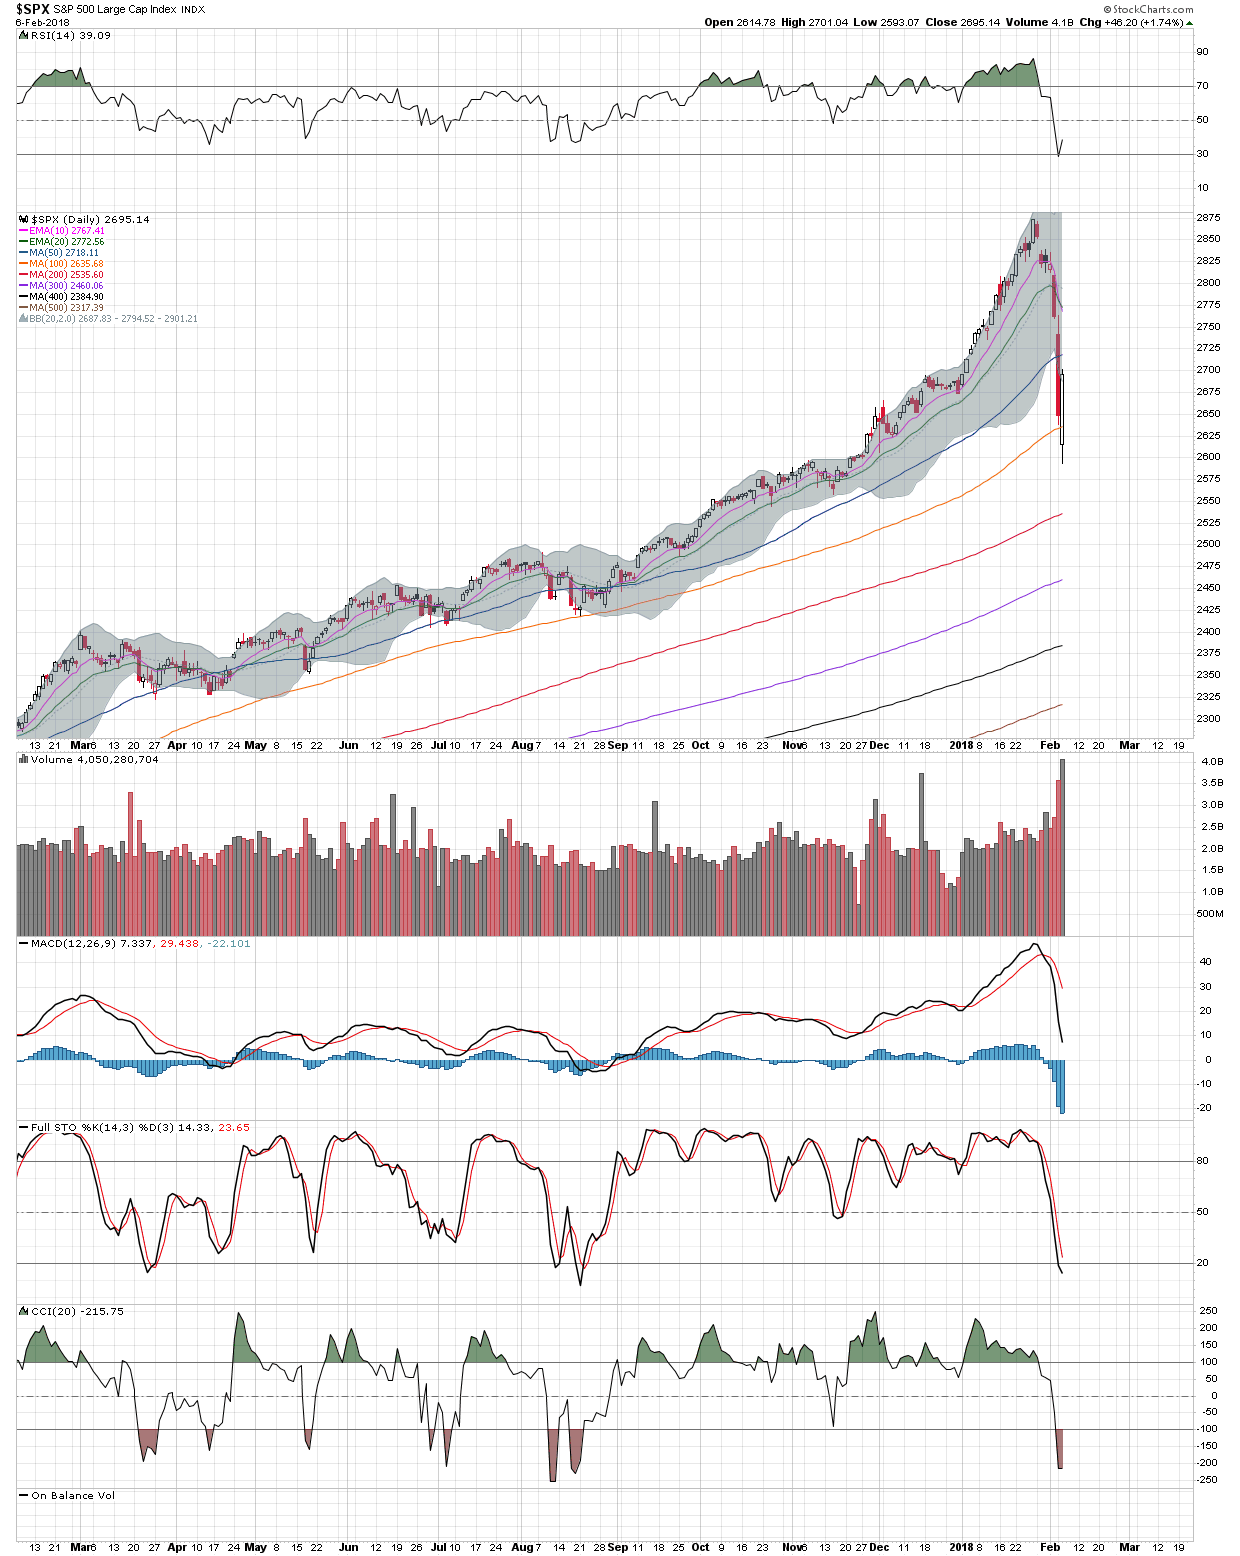
SMA 100 didn’t hold as support, price is overextended below EMA 10/20. Price tends to revert back to the latter when that is the case.
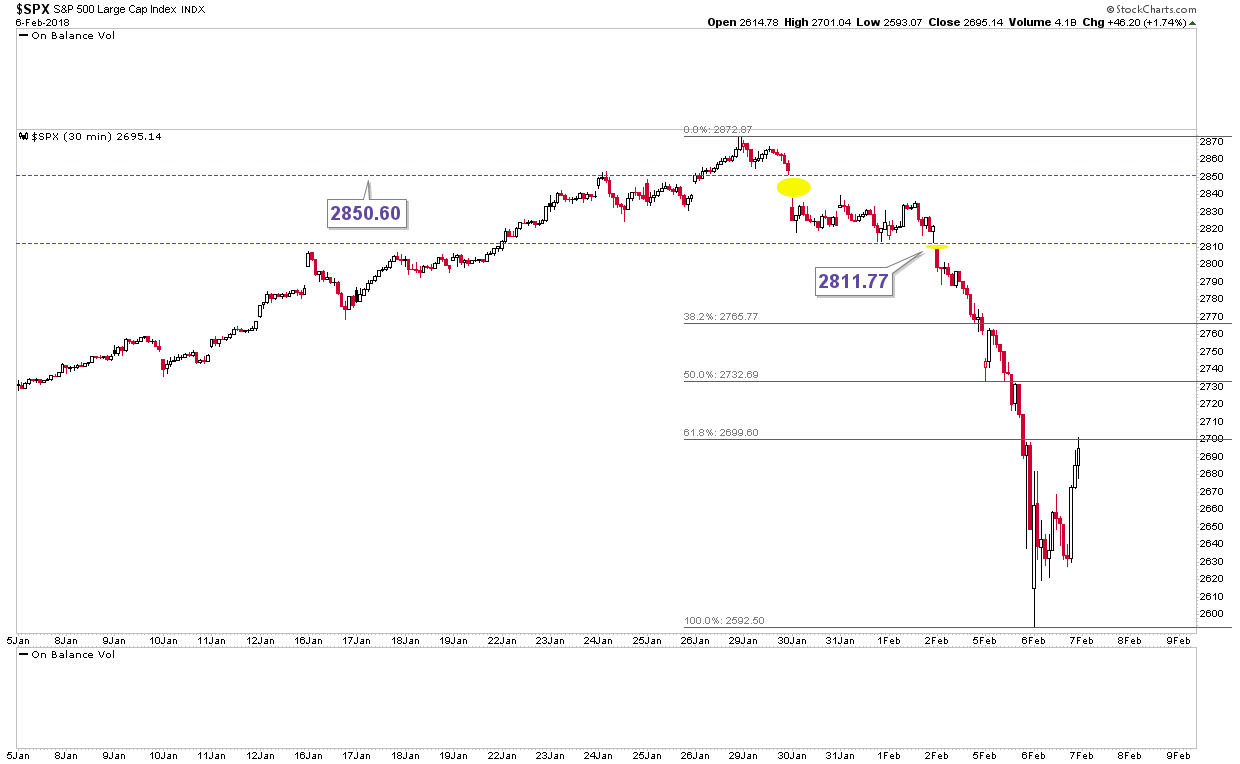
Nice double bottom on the 30 (or ‘W’ if you prefer), price has rallied up to the 1st Fib R level. Note the two gaps. What if price were to
rally and close both gaps (“yeah, bull market is back!!!!”), then begin falling again? Price would, potentially, begin building out a significant double top.
Another alternative would be for price to rally all the way back up to the neckline of the original H&S pattern. If that did occur, it would mean price
would also fill the first gap, at 2811.77, shown on the chart above.
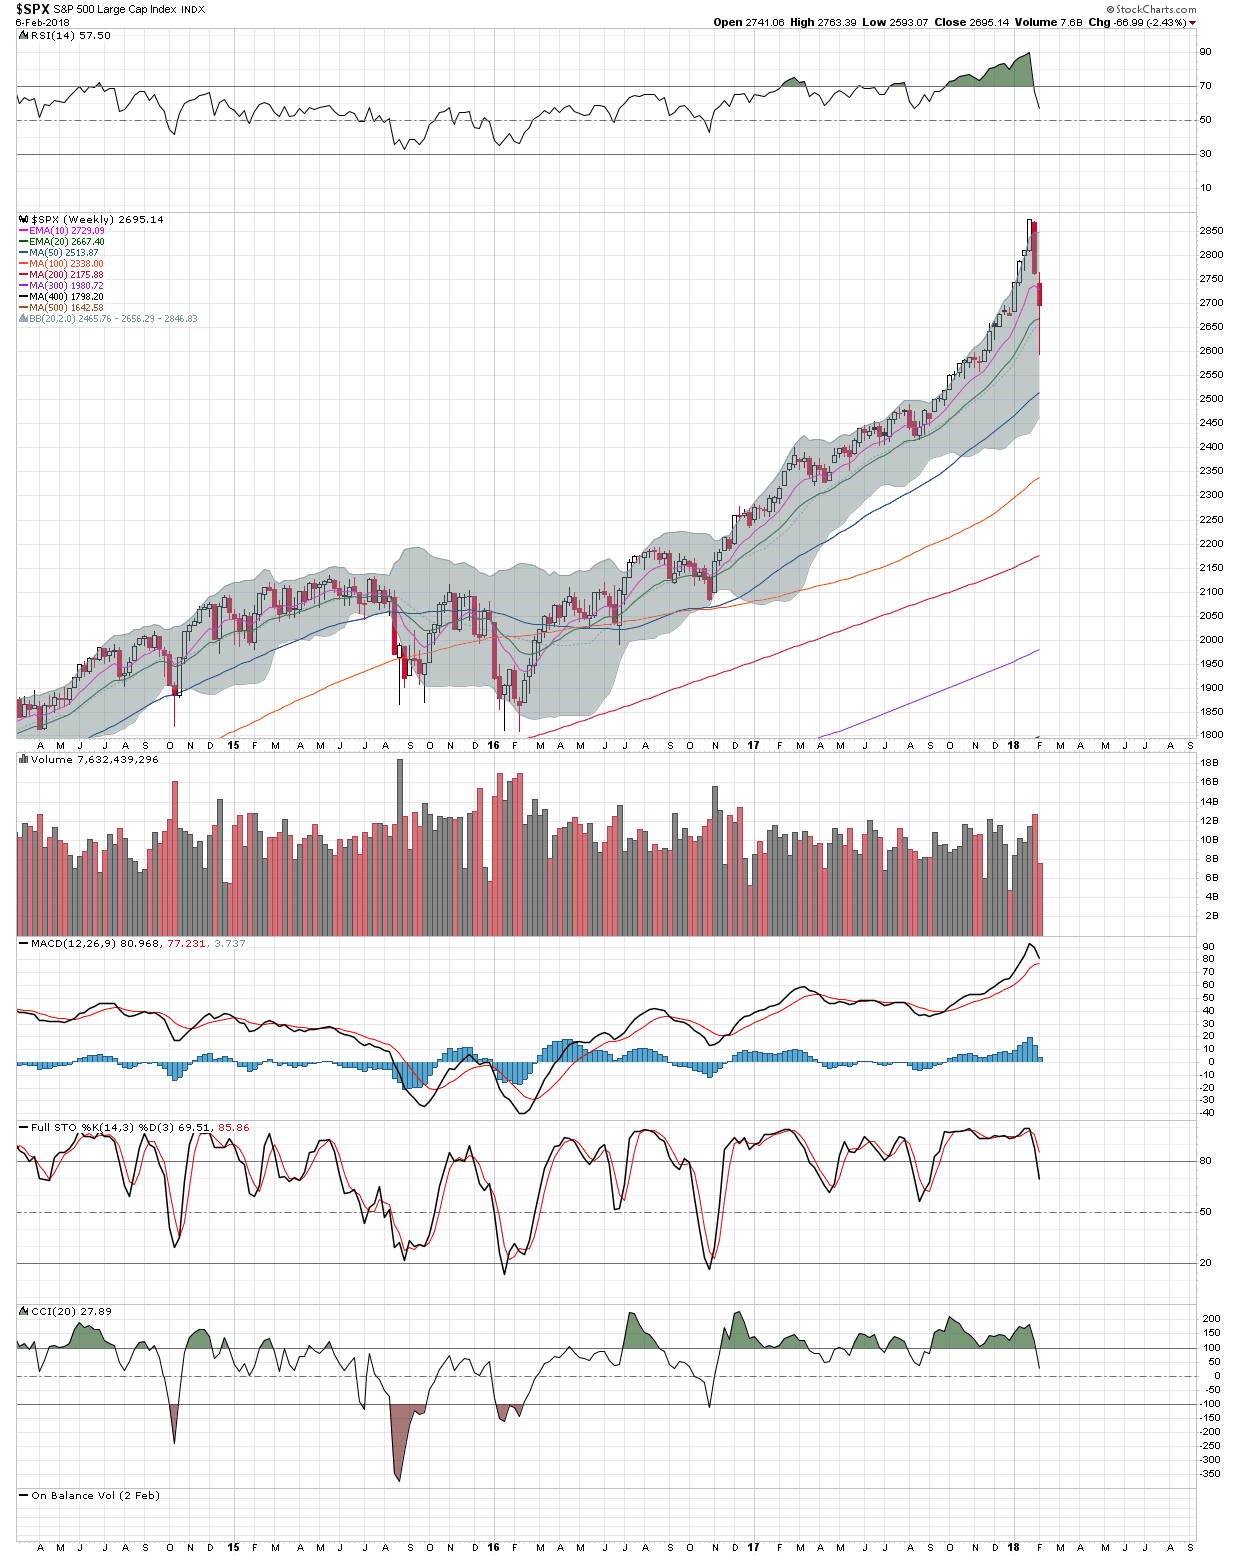
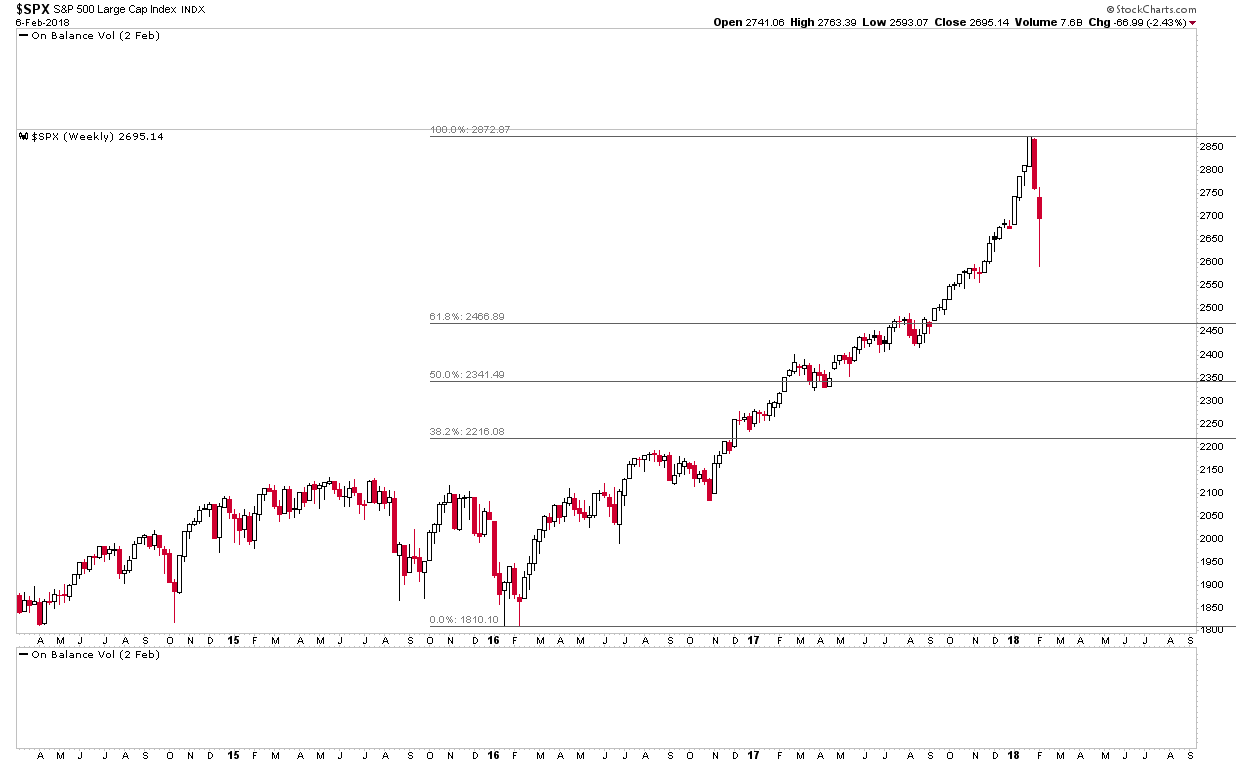
EMA 20 on the weekly didn’t hold as support.
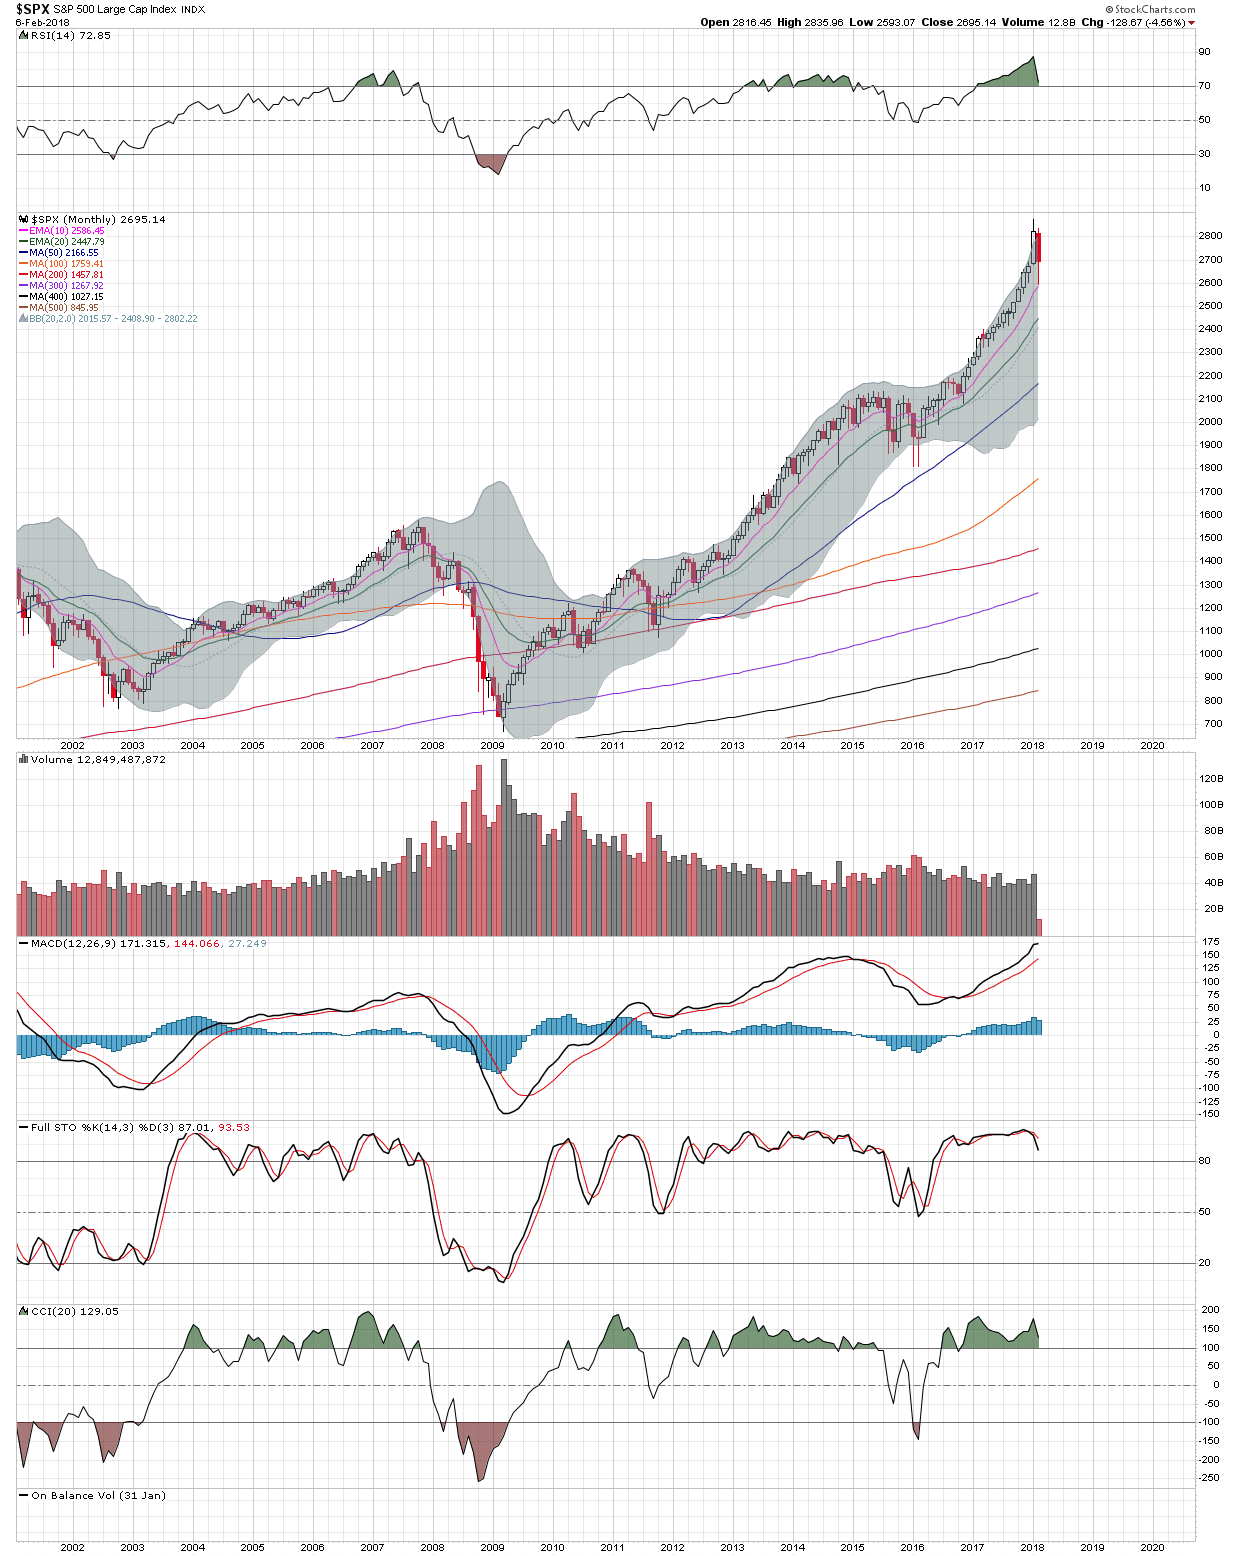
EMA 10 on the monthly could be considered as being backtested IMHO.
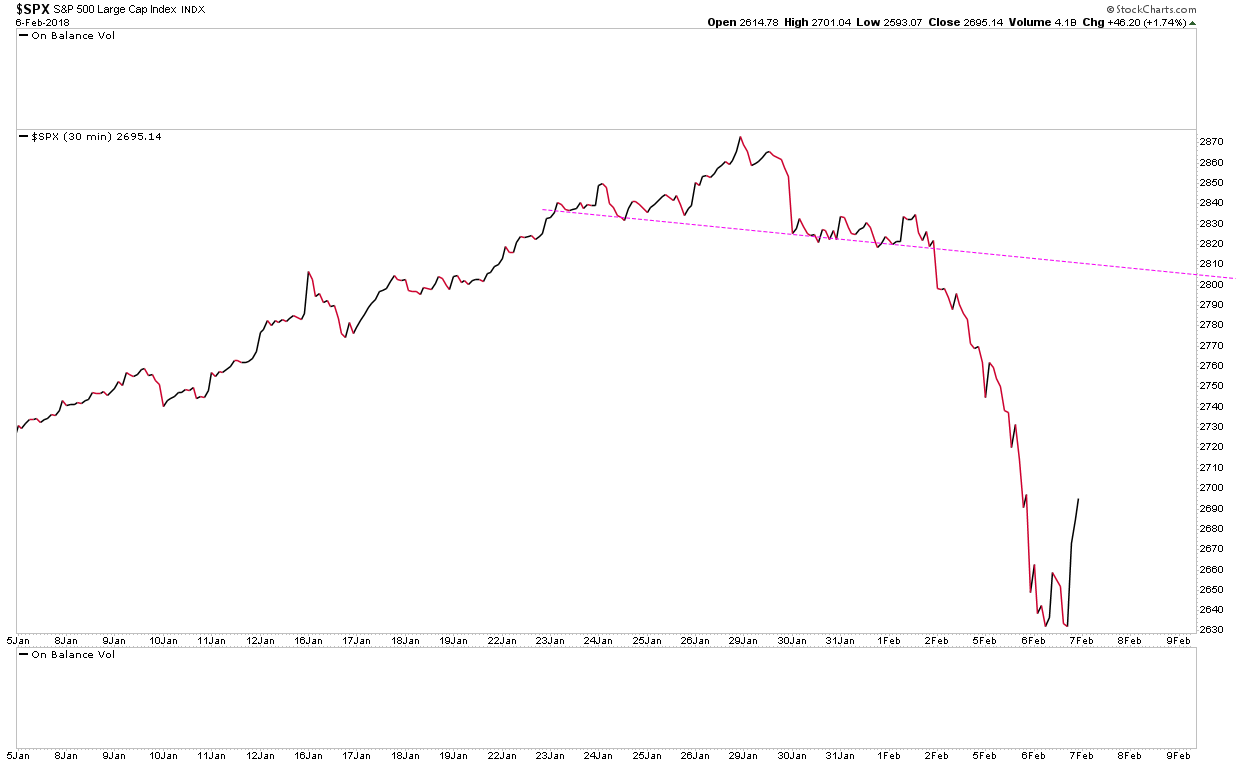
Self-explanatory.