Where Now ?
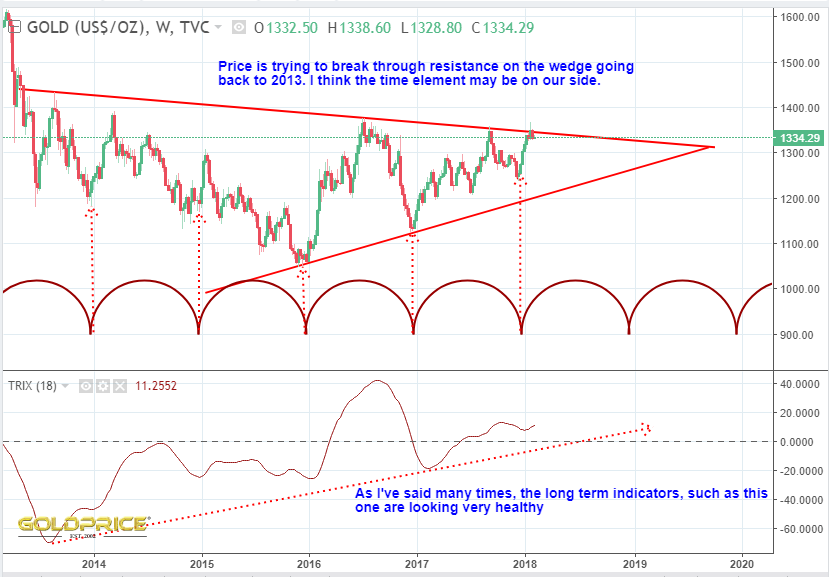
Cryptos are taking a massive hit, the stock markets had a tough couple of days and the dollar is staging a slight bounce, and as you saw in Graddhys post, bonds and yields are at a turning point (assuming you agree, but of course, you may not). So where does that leave PM’s ? Looking at the chart below, I still think we’re in the time frame for a breakout above the long running resistance line in the next few weeks. Support is down near $1200, so a drop to that level is certainly not out of the question. Those of us holding mining shares would need a change of underwear if happens though. After looking at the HUI chart, I have no idea just how low it would drop, but I don’t want to find out.
As I’ve already said, I have a strong ‘gut’ feeling that the miners aren’t going to get going until we see that clear breakout, with a move north of $1400.
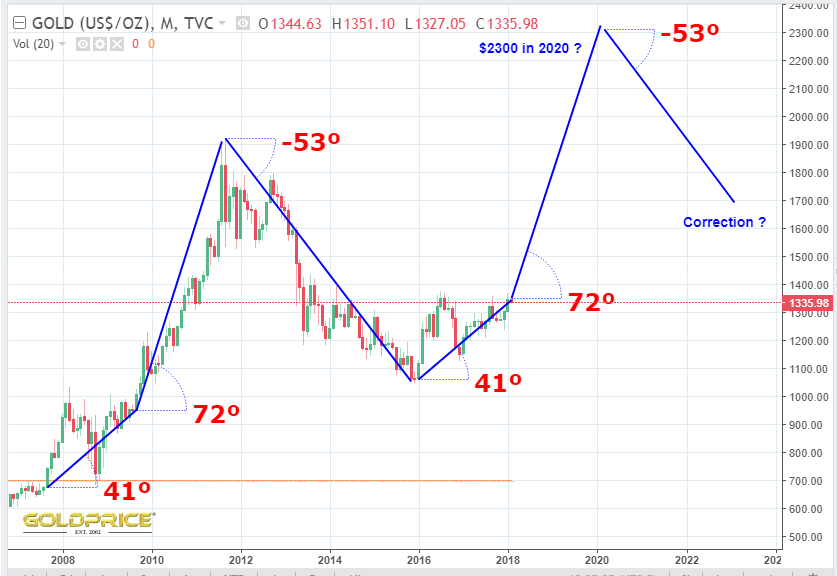
It’s interesting that the angle of ascent from the start of the move to now, is the same as it was when we built out a very similar chart pattern in the 2007-2009 period. That lasted about 2 years as well. Are we about to breakout and see the angle increase like last time ? Depending on the chart and scale you use, the angles are different, but they match (then and now). Anyway, I just find it curious, and can’t see why it would repeat exactly the same, but we’ll see I guess.
only direction is down. Digital stuff getting hacked, gov’t controls, hard to use systems, the list goes on. Would the Mexicans, India,Brazil and most of the planet which uses cash participate in such unknown idiotic business transactions in everyday life. Call me crazy but when the markets crash and mortgages rise I feel the last thing on ones’ mind would be to buy some crypto. Strange as it is, worthless paper bills in hand would feel better than some digital thing. Are we not worried that our digital accounts can be frozen, why not freeze coindesk and co. ? Here in Canada if they classify it as money laundering or something and say you bought bitcoin at 5k and sold it at 8k. You would think taxed on 3k profit but gov’t assess the sale at 20k and tax it at that point. Same goes for tax free savings account if abused with trades as that vehicle only designed for the average person, not the experienced day trader flipping money as a day job. Beware out there.
https://www.thor.ca/tax-alerts/punitive-tfsa-audits/
http://business.financialpost.com/personal-finance/stop-using-your-tfsa-to-frequently-trade-stocks-the-cra-may-see-it-as-business-income
http://www.advisor.ca/news/industry-news/watch-for-this-tfsa-trading-pitfall-240609
Those articles dont surprise me Highroller. Another government created road block to detour people from moving their $$ away from the products the system wants people to own. Another form of heard control.
Nice charts Northstar. It seems conviction in both the bulls and bears are at or what seems like an extreme. My guts meaningless opinion says were nearing or staring a resolution in the face one way or the other. My bets on your bottom chart.
Thanks for the comment optional. Despite all the gloom, the gold chart still looks perfectly healthy to me. The miners will catch on eventually.
Thanks Northstar.