Bull or Bear GDXJ, GDXJ/GLD – Weeklies
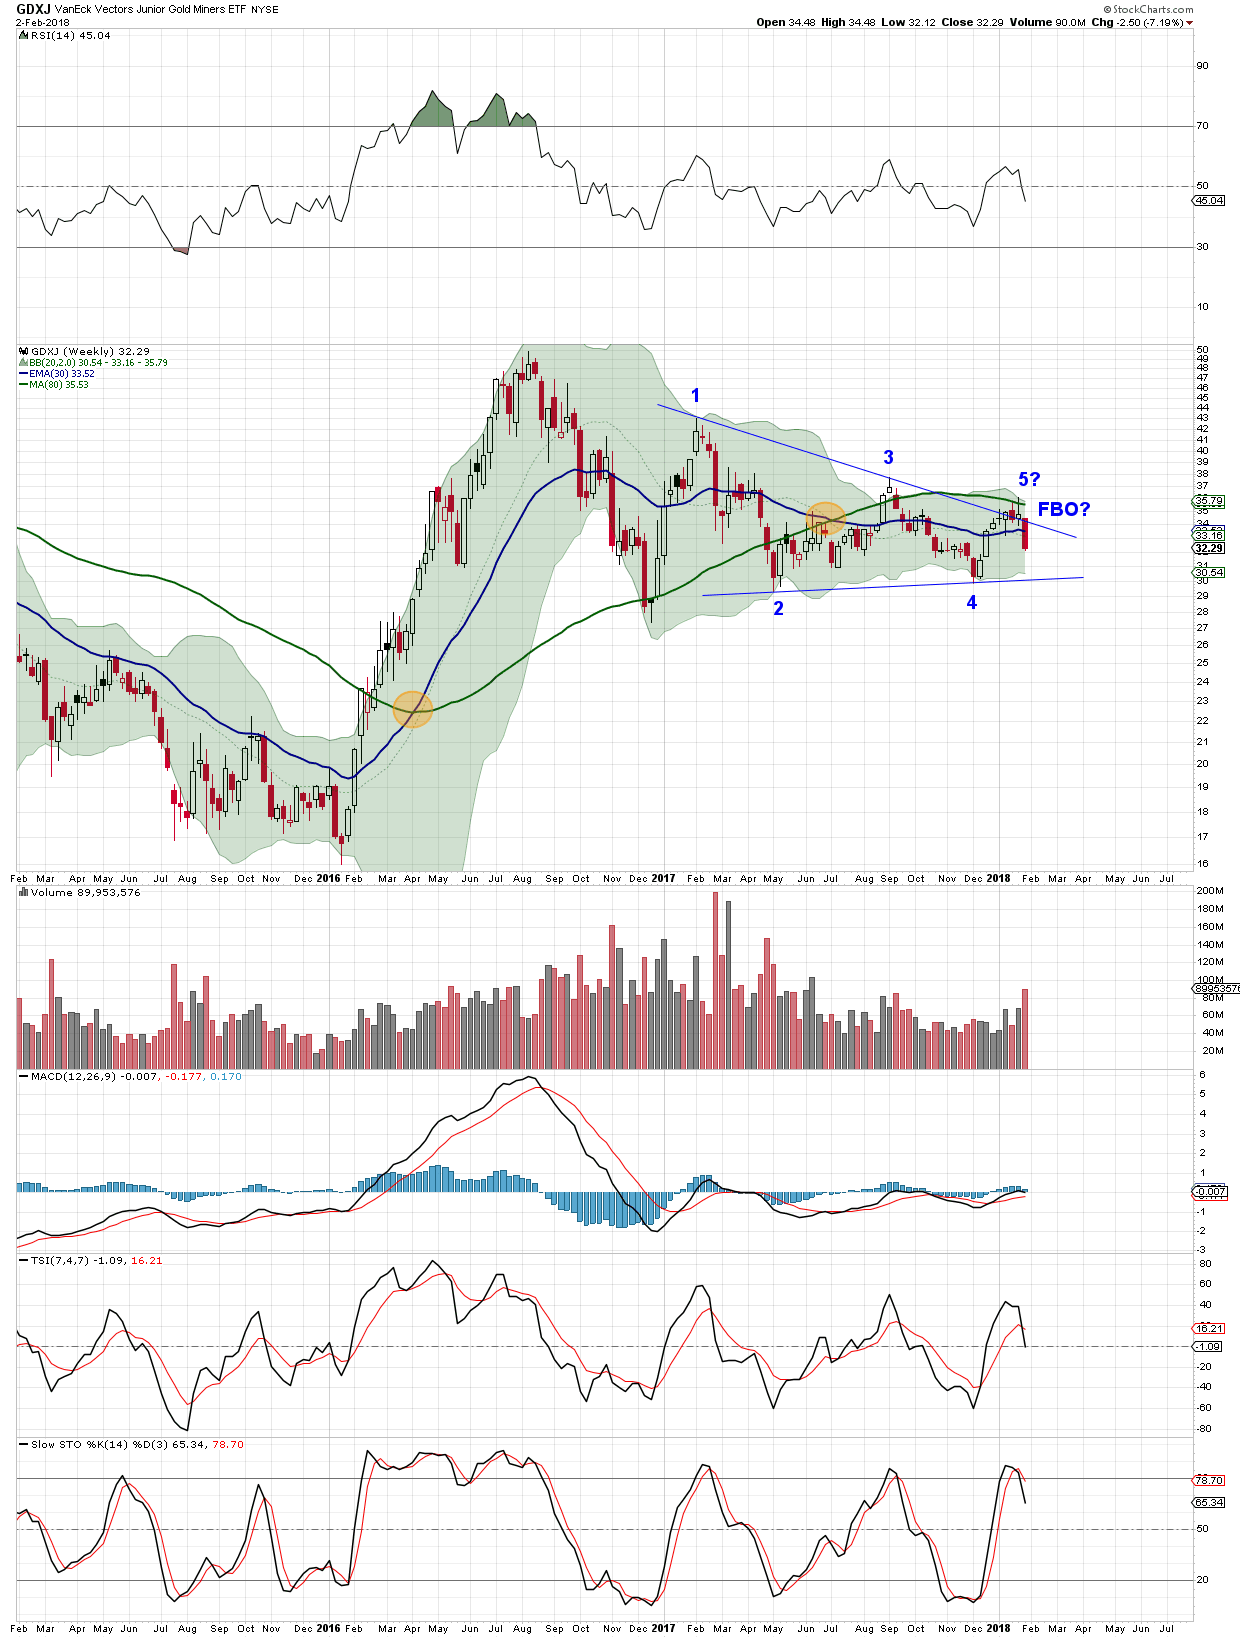
Thanks Eagle, for the introduction to Henrik Z. Jensen and his charts. Have redrawn the triangle consolidation of his weekly GDXJ chart. There are other ways to draw the recent consolidation, but his interpretation is as shown, a triangle with a FBO at reversal point 5. We already know the potential implications of a FBO.
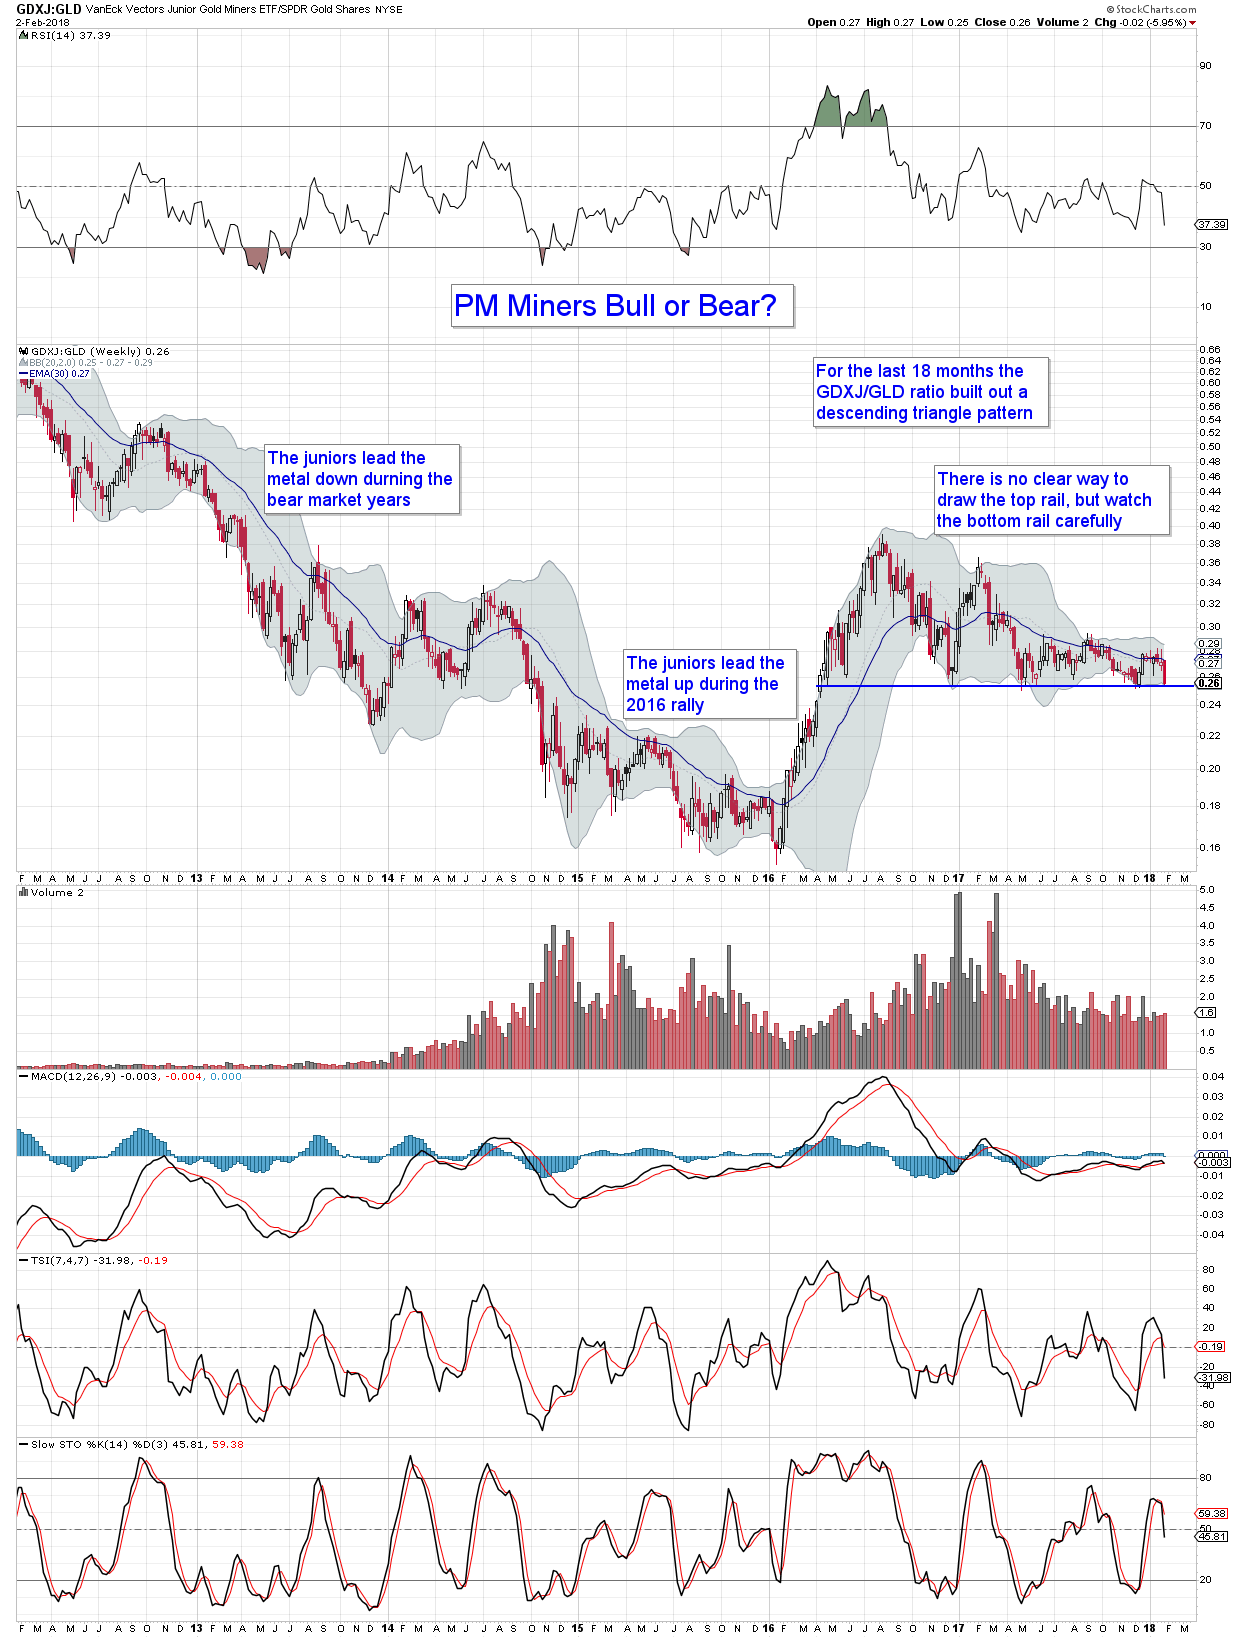
Here is a look at a weekly chart of the GDXJ/GLD. A break of the bottom rail on a weekly basis, IMHO, would be a very bearish development.
EDIT: It is more accurate to say the MINERS were WEAKER than the metal in the bear market years, and STRONGER than the metal during the 2016 rally (using GDXJ as a proxy for all the miners) In any case a break of the bottom rail could mark a significant development.
I’m sticking with my EW interpretation.
Off Dec 2015 lows, A up to summer 2016 highs.
Now B down, as abc. Where b is the triangle you outline (and HZJ does too).
So c of B down underway.
Then C up to 1500+ to complete the upwards correction.
Then it ALL blows up.
Excellent Charts Foxy. That is THE one IMO GDXJ:GLD
Pass the popcorn.
Hold that Line !!
Ditto!