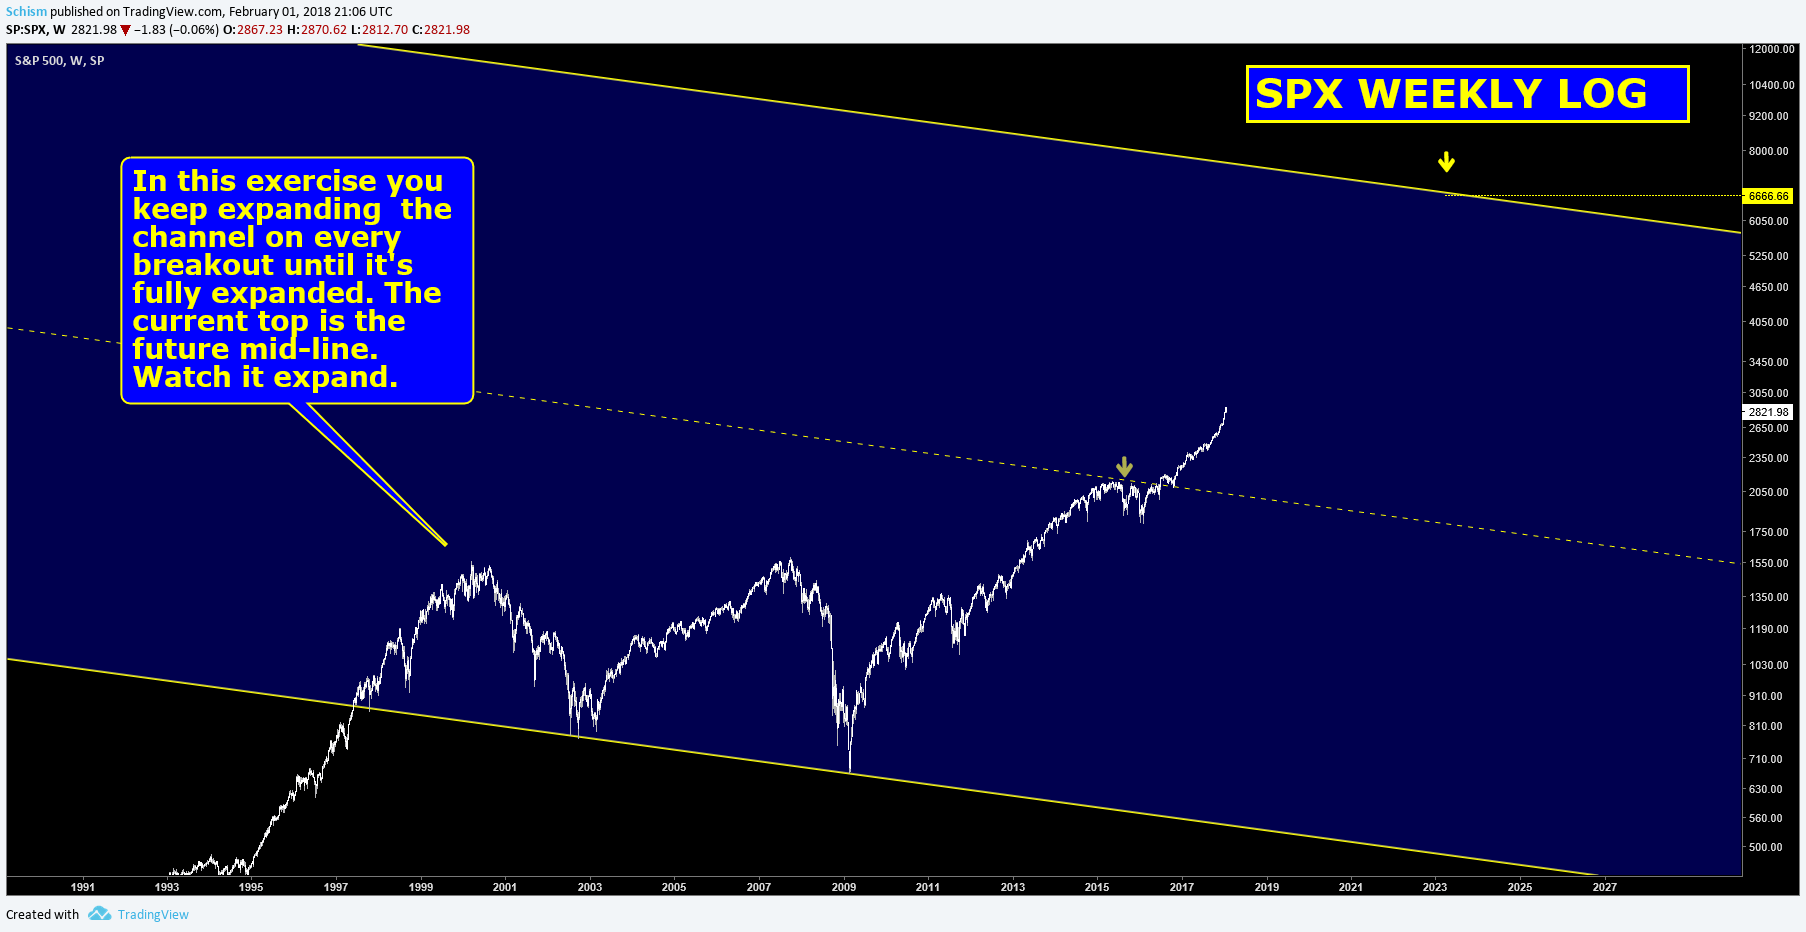
SPX
A couple interesting hits on these charts. Have had them drawn for a while but never knew if they would mean anything. Screenshots are from yesterday so todays action isn’t on there.
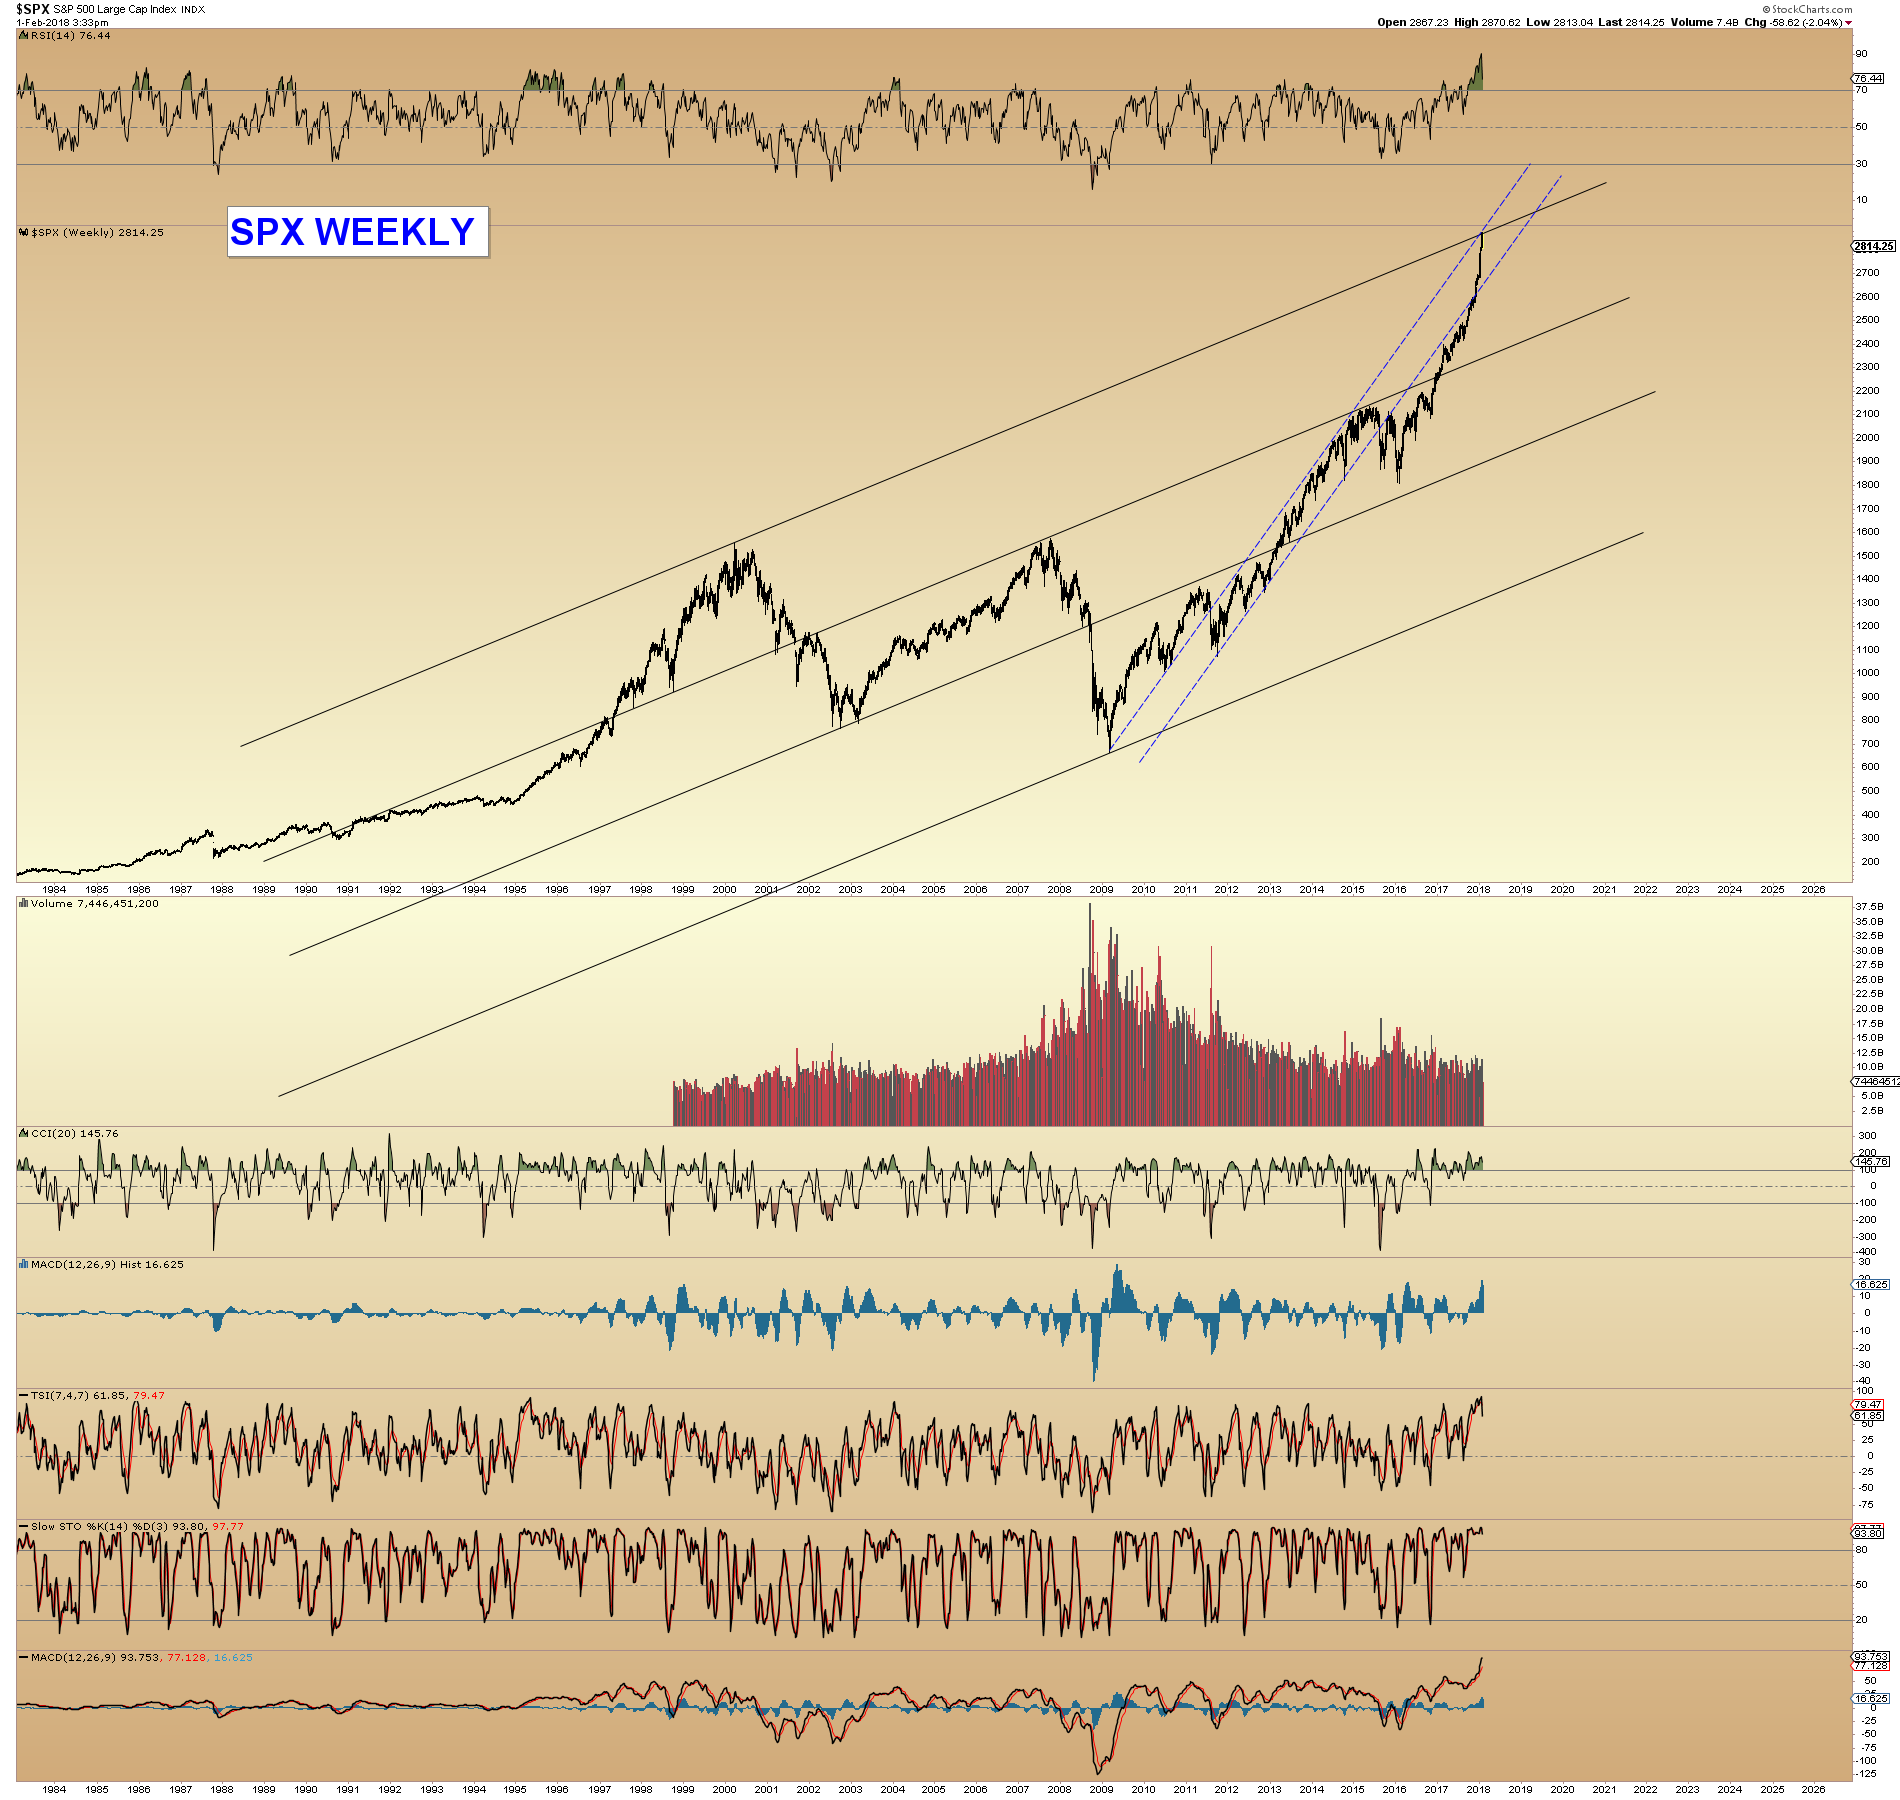
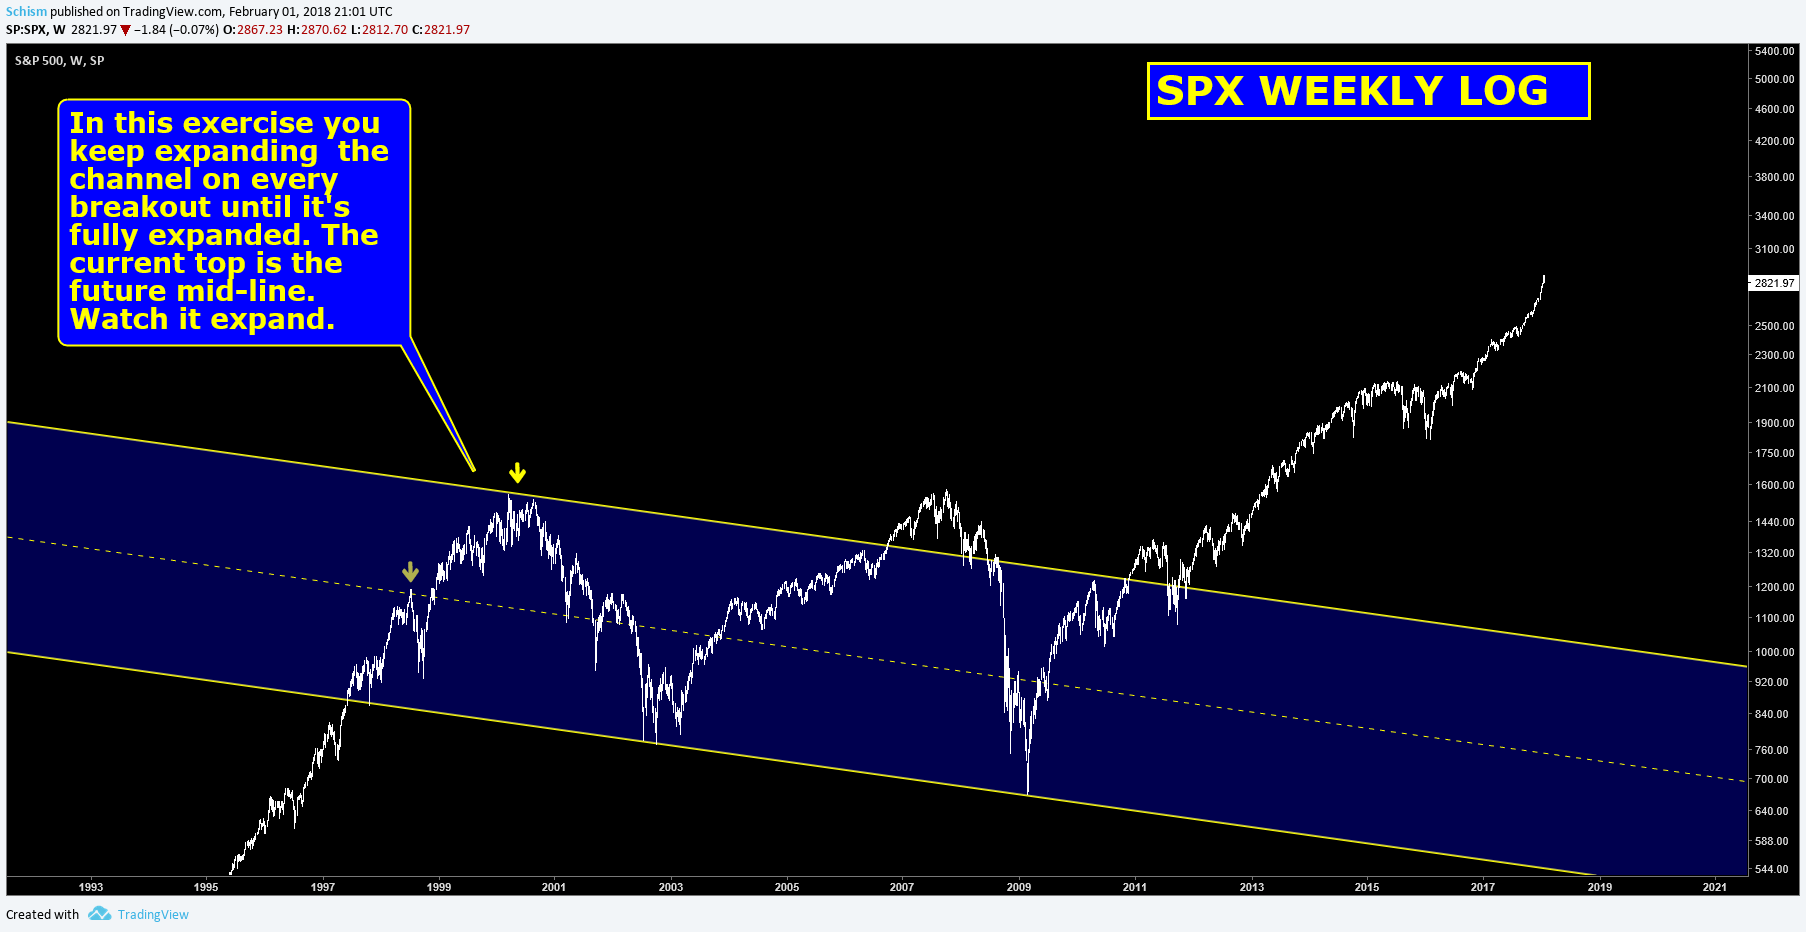
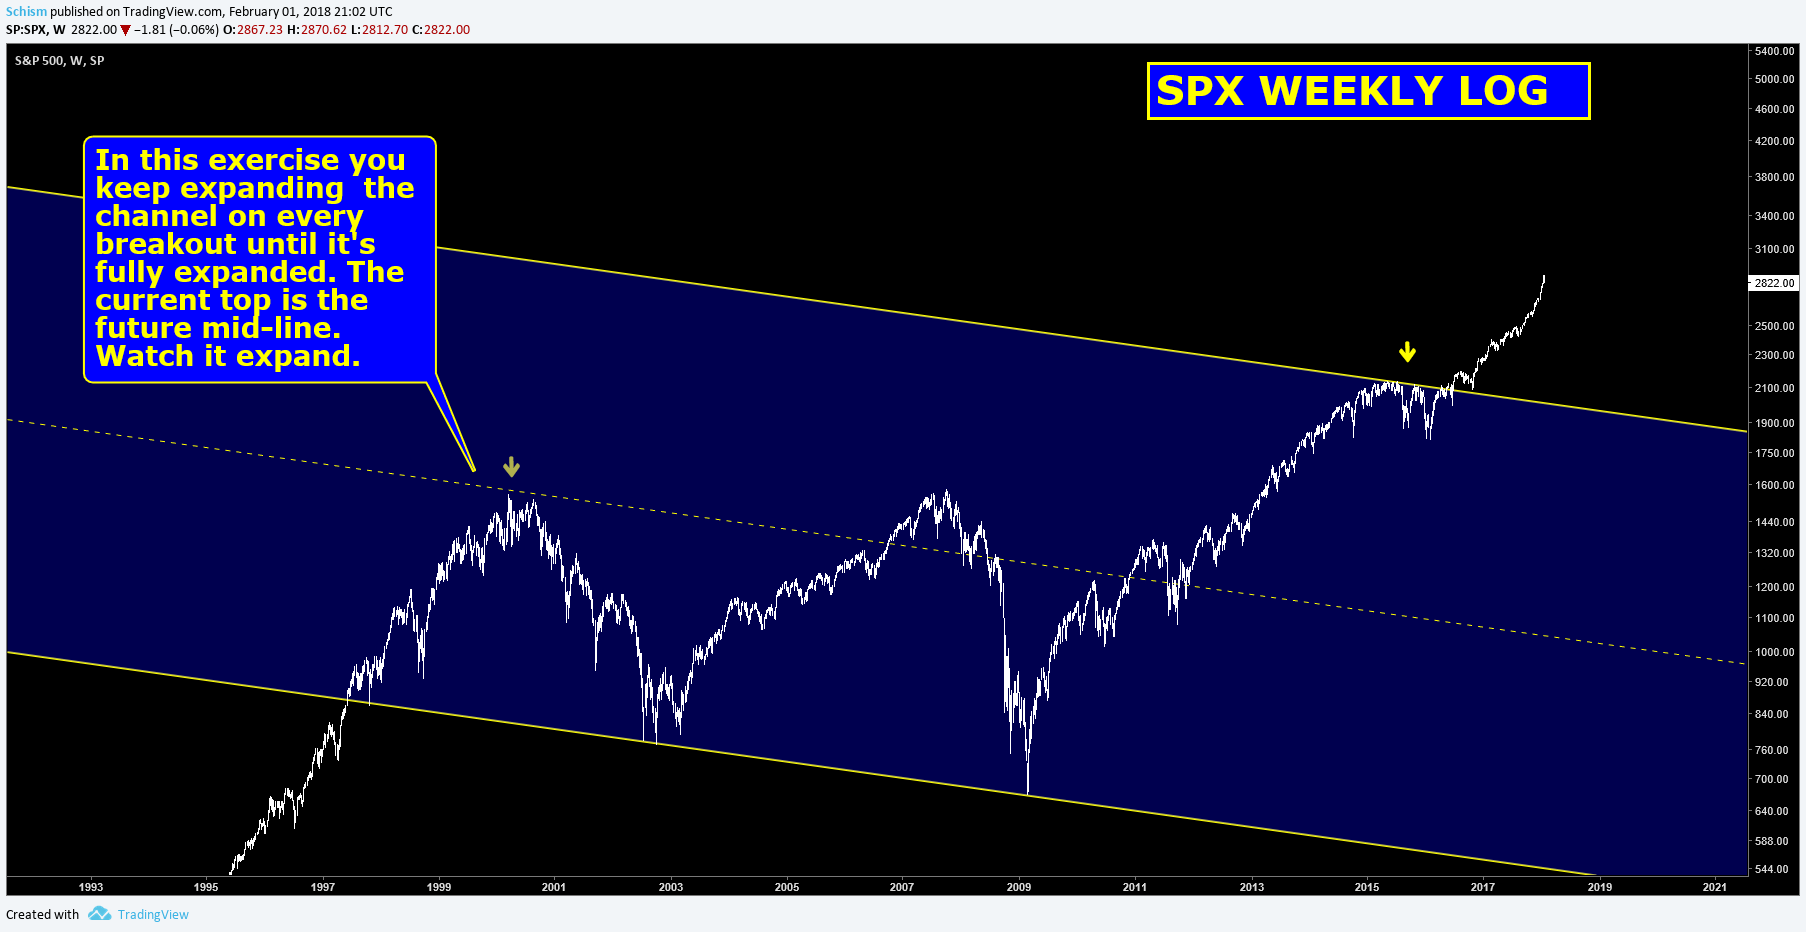
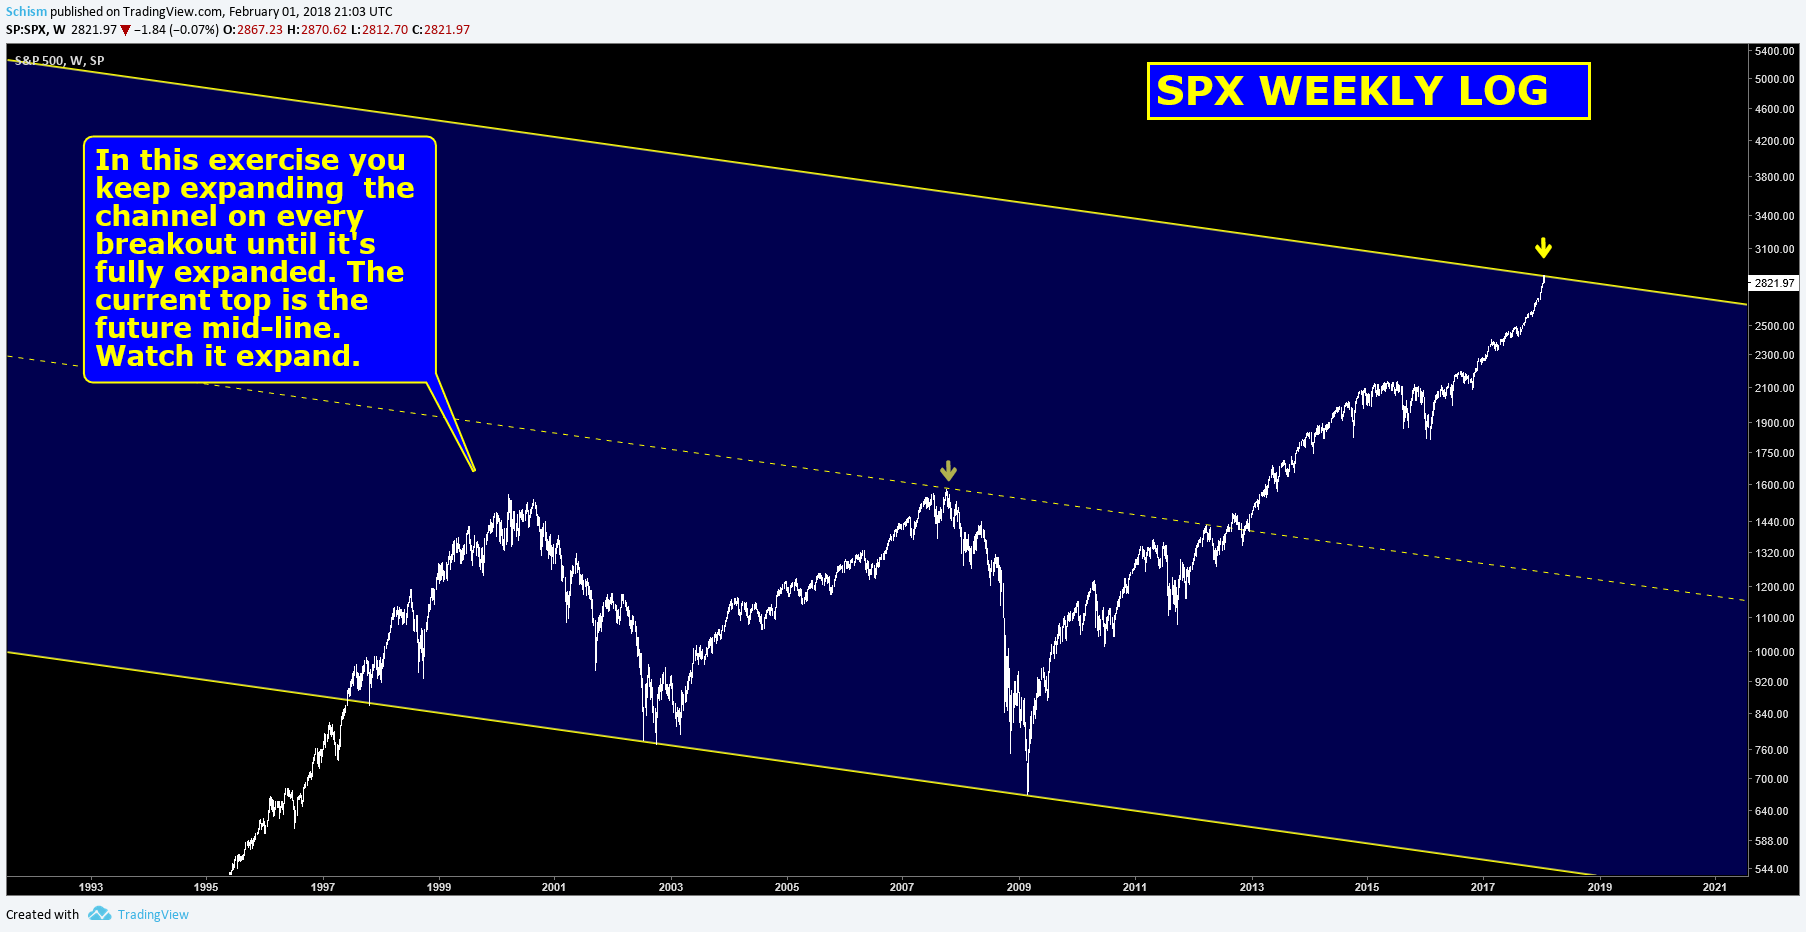
These four kind of need to be seen in order to make any sense and hell they still might not make any sense.
The last chart is assuming the SPX is going to 10 bag by the end of a 2 term Trump and not be a top like chart 3 could be construed.
Your right…that’s hard to get the head around Sir Schiz !
Way out of the box as usual…
I do get the target….that would be somethin’