Applying Ichimoku to ratio charts
Ichimoku is a very useful trend following indicator and gives additional insight into support and resistance
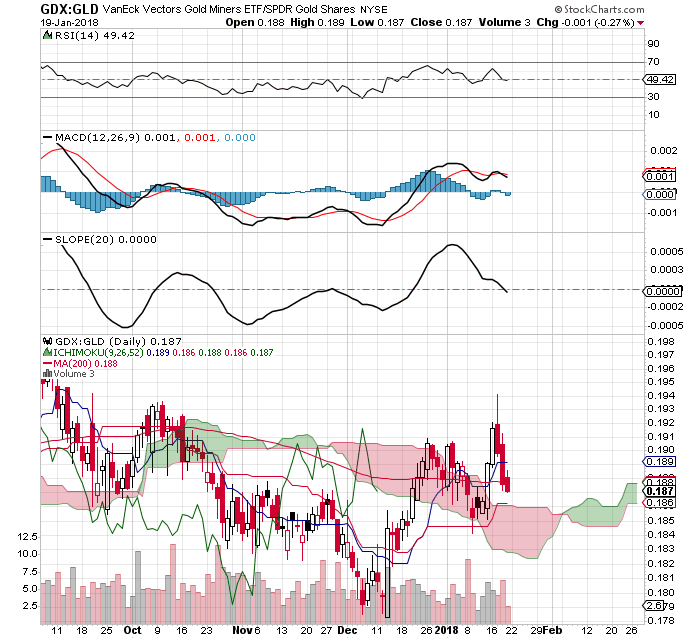
The gdx:gld ratio chart here shows the negative divergences which formed in the ratio prior to the selloff. The encouraging feature is that the cloud band projected into the future is green and trending up suggesting that the trend can resume to the upside on this time frame. The test should now come at the red signal line at the top of the current cloud (1.86). Failure to bounce at that level implies the weekly downtrend trend is still dominant and the rally is over. The ratio is then likely to test the 200 week m.a. which has happened on the last seven occasions