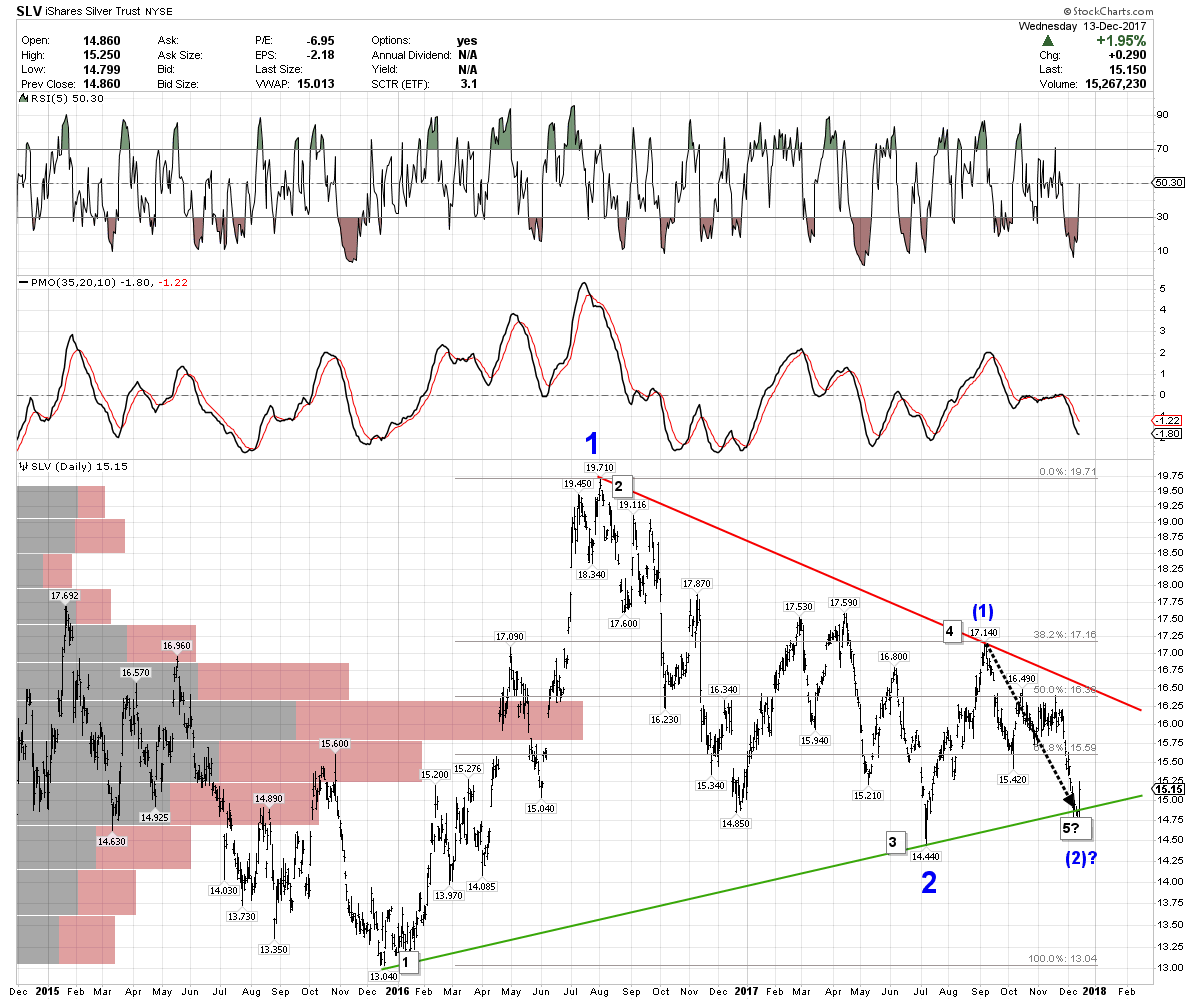
$Silver (SLV) – Daily
Gaps have been filled, a major trendline has been hit, and a predictable bounce has occurred today. Hard to believe we are still consolidating off the baby-bull high of August, 2016 – which seems like a lifetime ago…
Will point 5 be the reversal point that initiates an upside breakout of this symmetrical triangle? If so, that would likely indicate for E-wavers that the July low can finally be penciled in as the completion of wave 2 of 5. Of course, SLV would still need to take out the cycle high of $17.14 as confirmation impulsive wave 3 has truly begun (at long last), and notate wave 2 in ink…
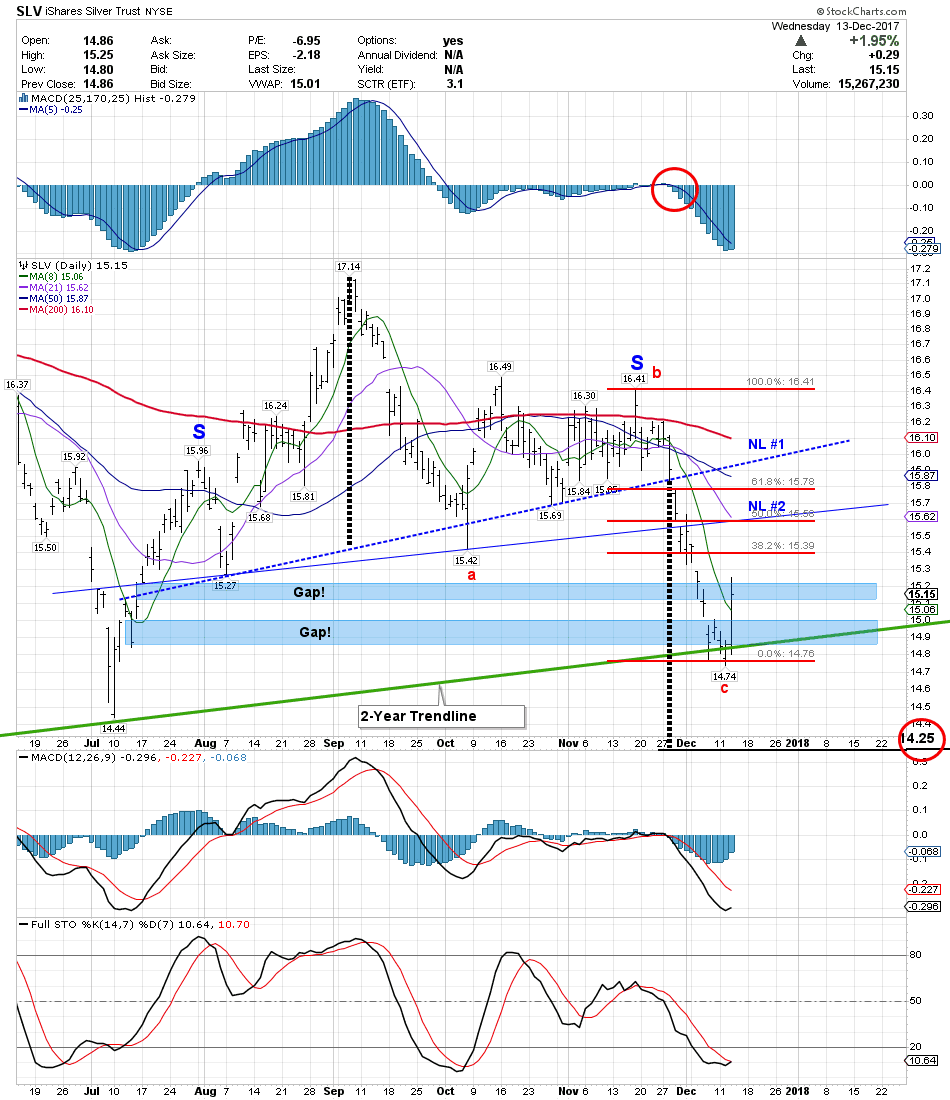
In the case of Silver, if in fact wave (2) has completed – it has done so with a quirky looking and muted wave b rally, having never really challenged the prior $17.14 high. However, E-wavers observe that wave c is often the same distance as wave a, in terms of where to anticipate a completion of wave (2). So, in the chart below I have imposed a (red) Fib retracement grid which measures the distance of wave a, and placed it at the end of wave b – and sure enough – wave c is only 2 cents off from being the exact same distance. All that to say its looking good for the completion of wave (2) and thus wave (3) of 3, always a tasty treat, to be in play…
Of course, the downside target of $14.25 is still looming there from the H&S breakdown, so…
“We shall see”, said the blind man to the deaf woman.
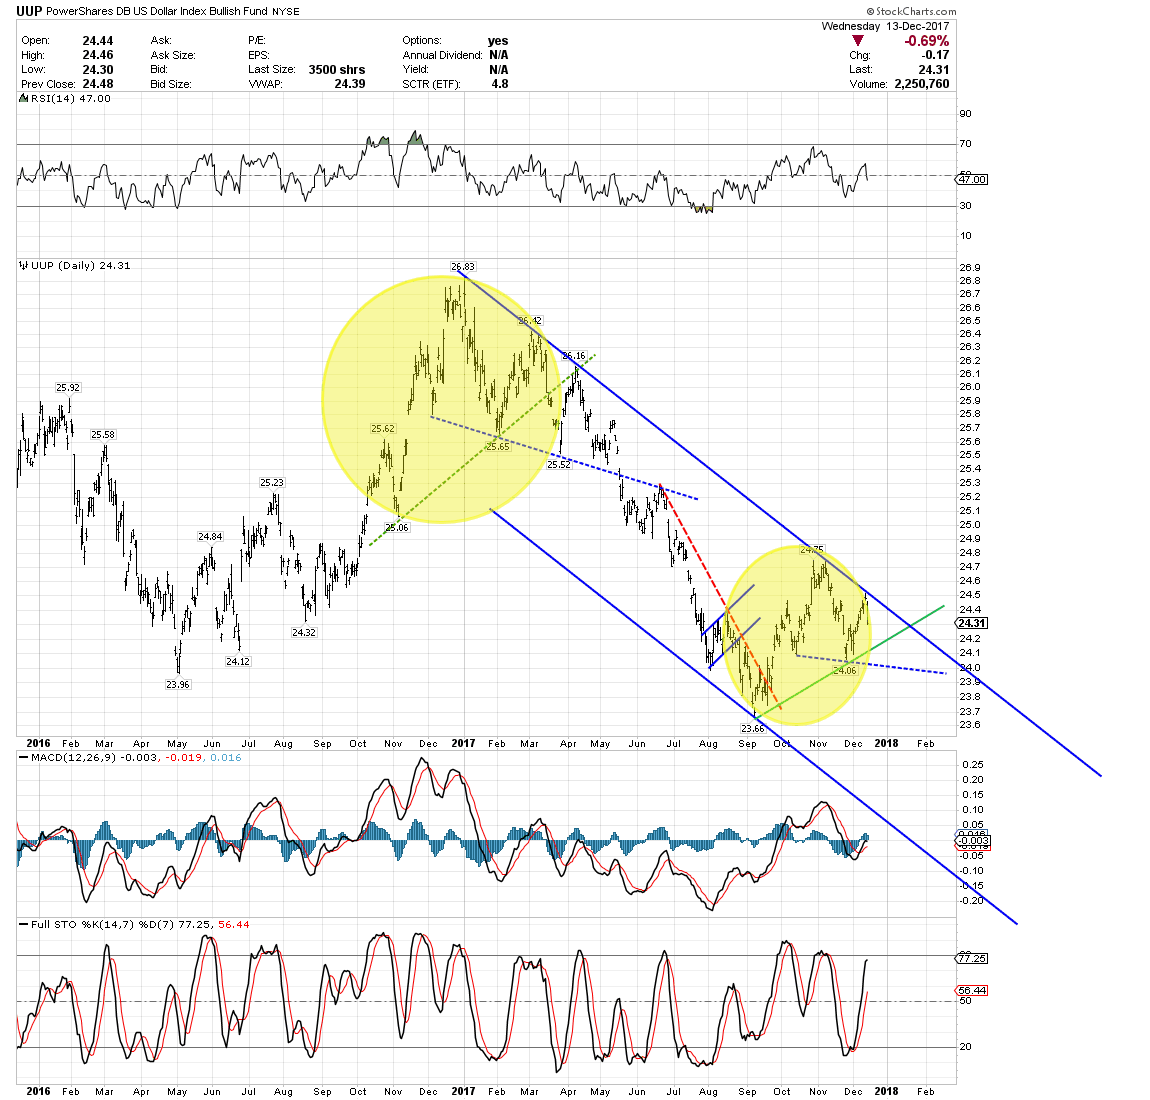
In the meantime, the USD via UUP, appears to have been turned away once again by trendline resistance. I have also highlighted what appears to be fractal-looking price action indicating that lower lows are forthcoming over the coming months, which lines up with a bullish pm scenario.
Good job marrying Chartology with EW RTV
tx fully!
just added an UUP chart at the bottom, which is looking bearish to me –
Well now that is a very Rambesque chart RTV….you are a quick study
🙂
Some great thinking there. Thanks for sharing.
Awesome stuff. Thanks RTV