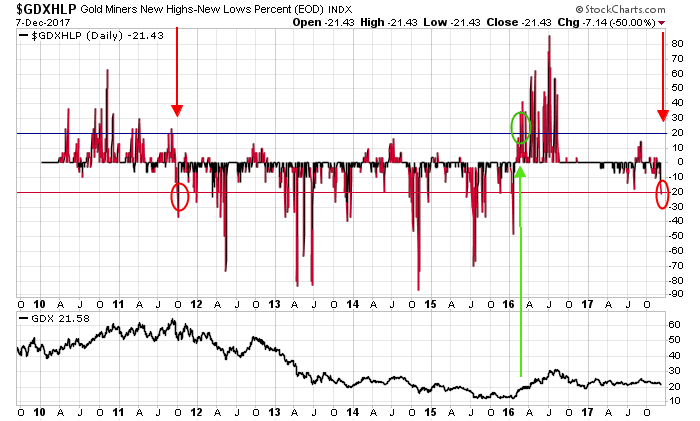
Long-Term PM Sell Signal
Here’s a home grown signal I developed some time ago. It uses $GDXHLP (New highs-New Lows percent). The way it works is if we go above +20%, it is a long term buy signal and stays in a buy until we go below -20%. And vise-versa until +20% again. As you can see, we went below -20% in 2011 (a sell signal) when GDX was around 50, then went above 20% in 2016 (a buy signal) when GDX was around 18, then we got a sell signal today ($GDXHLP below -20%) and GDX is about 21. I guess you could call this a negative divergence since the GDX has been fairly level over the past year (speaking in a long-term sense) while new highs-new lows has been deteriorating. Based on this signal, which admittedly has a limited track record, we are headed lower in a long term sense.
Thanks Ken 🙂
could your signal be marking a low?