Commodities : The Big Three
Excerpt for Goldtent Readers
Tonight I would like to show you some long term charts for the big three, Copper, Oil and Gold. There are a lot of similarities between them which is strongly suggesting all three should be in new bull markets. The laggard is gold which has still not confirmed its new bull market but is getting closer as you will see. The key will be what the US dollar has up its sleeves so lets start with a daily chart for the US dollar.
The US dollar still hasn’t totally broken down yet, but it did have a failed inverse H&S bottom. It was a very beautiful and symmetrical H&S bottom that looked like it was going to reverse the downtrend that is right at a year old now. It had a nice clean breakout above the neckline with a clean backtest from above. All looked good. After a brief rally the US dollar declined once more to the neckline, but this time the neckline failed to hold support, strongly suggesting the H&S bottom was failing.
As we’ve discussed in the past when you see a failed H&S pattern you often times see a strong move in the opposite direction. The rule of thumb is that when the price action breaks below the right shoulder low the failure is complete. The US dollar is still trading slightly above the right shoulder low, but is now getting close to breaking that important low. Note how the neckline reversed its role to what had been resistance during the formation of the H&S bottom, to support once broken to the upside, and then reversed its role one more time to resistance on the last backtest from below.

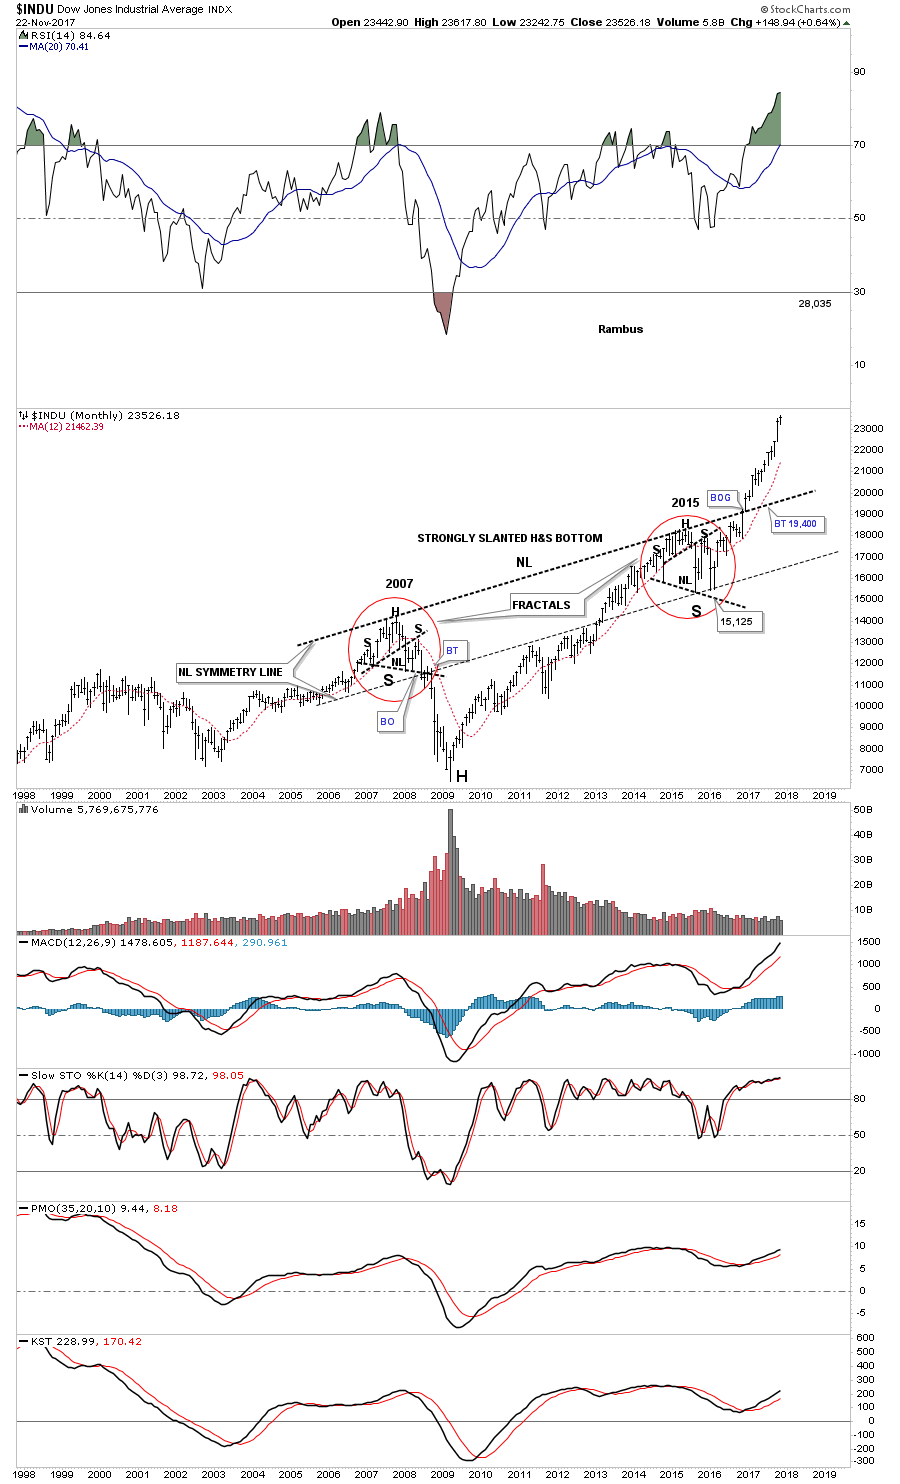
Below is a 20 year monthly chart for the INDU which shows you what can happen when you see a failed H&S pattern. In 2007 that H&S top worked out beautifully, but it was a different story altogether in 2015. The two H&S patterns were about as symmetrical as they could be, but when the price action broke out above the right shoulder high in early 2016, the failure was complete and we have gotten a very strong impulse move in the opposite direction . which has been and continues to be a very good trade for members who are participating via the various sector ETFs in our portfolios.
Commodities should enjoy a weaker US dollar as they generally run inverse to each other. About 5 months ago Copper broke out from a very symmetrical H&S bottom on this 20 year monthly chart with no backtest to the neckline so far. There are no rules that says we have to have a backtest, but many time we do.
Now lets take a look at WTIC, Crude Oil, as it has a similar setup to Copper. Copper is a little further along in its breakout move as oil is just now in its second month
Comprehensive Report For Rambus Chartology Members
https://rambus1.com/2017/11/22/wednesday-report-186/
Happy Thanksgiving Commodity Bulls
🙂
Thank you for the great excerpt.
I hoped for the dollar to reach 97,so I could sell my dollars with a profit,but i seems the odds are grim for the green buck……