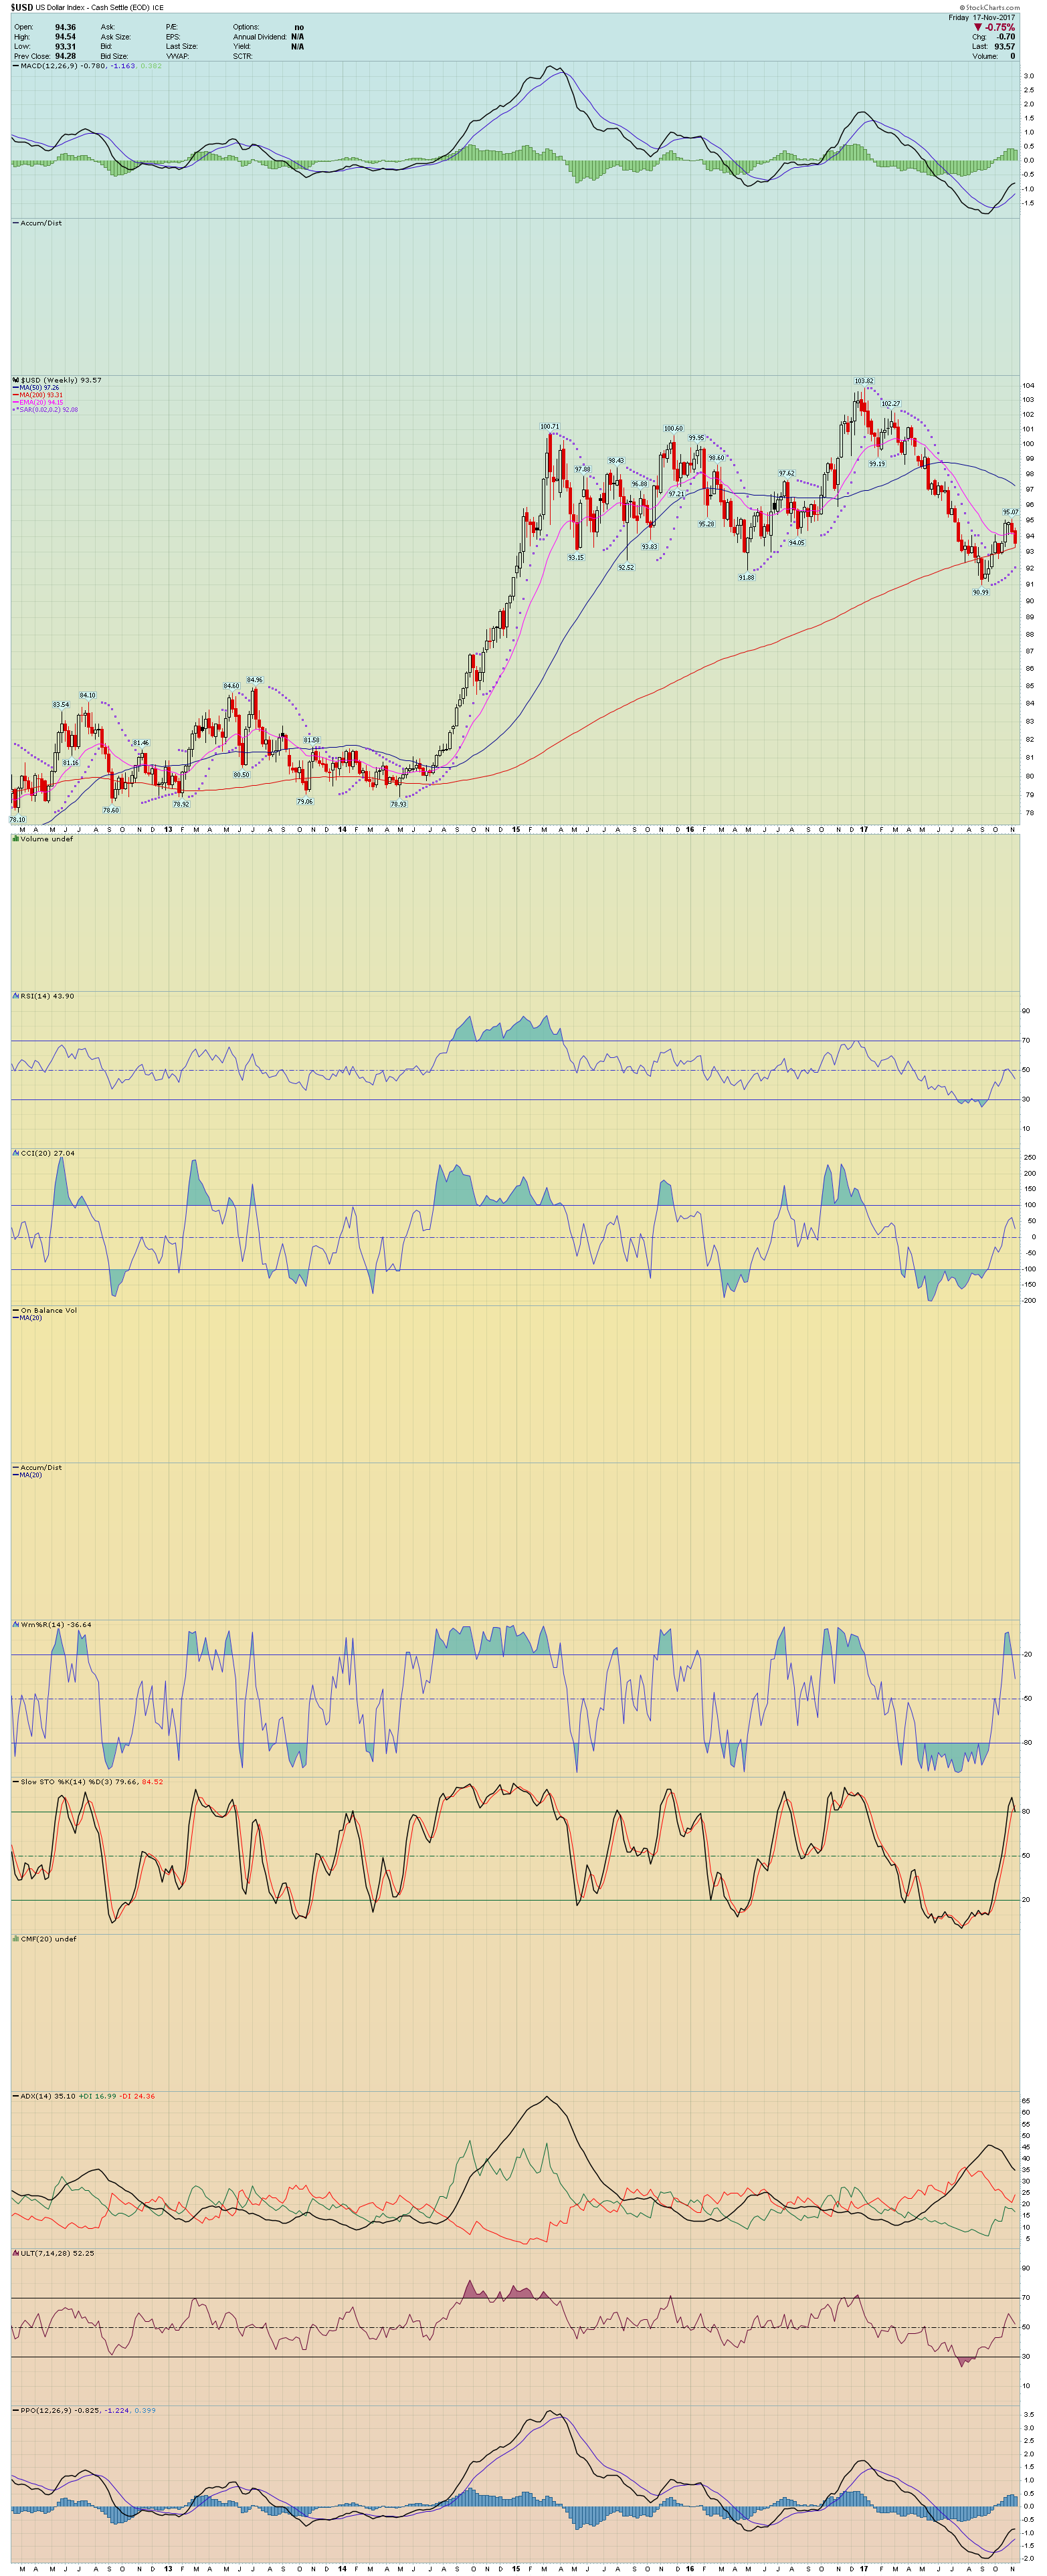
Another take on the USD
In this weekly chart of the USD, we see a huge topping process in 2015 and 2016. In December 2016, the buck starts its bear market in earnest. Compared to the top, the run downhill is small so far. The minuscule upturn looks very much like a bear flag. Every indicator is pointing down including the moving averages except the 200 which I believe will follow suit. The dollar was unable to move above 50 on the RSI before it turned down again. For now, I am betting on a continued downward movement in the buck unless this chart and the daily chart start showing some serious bullishness. JMHO.