$Gold – Daily
Gold is looking “frisky” to me…
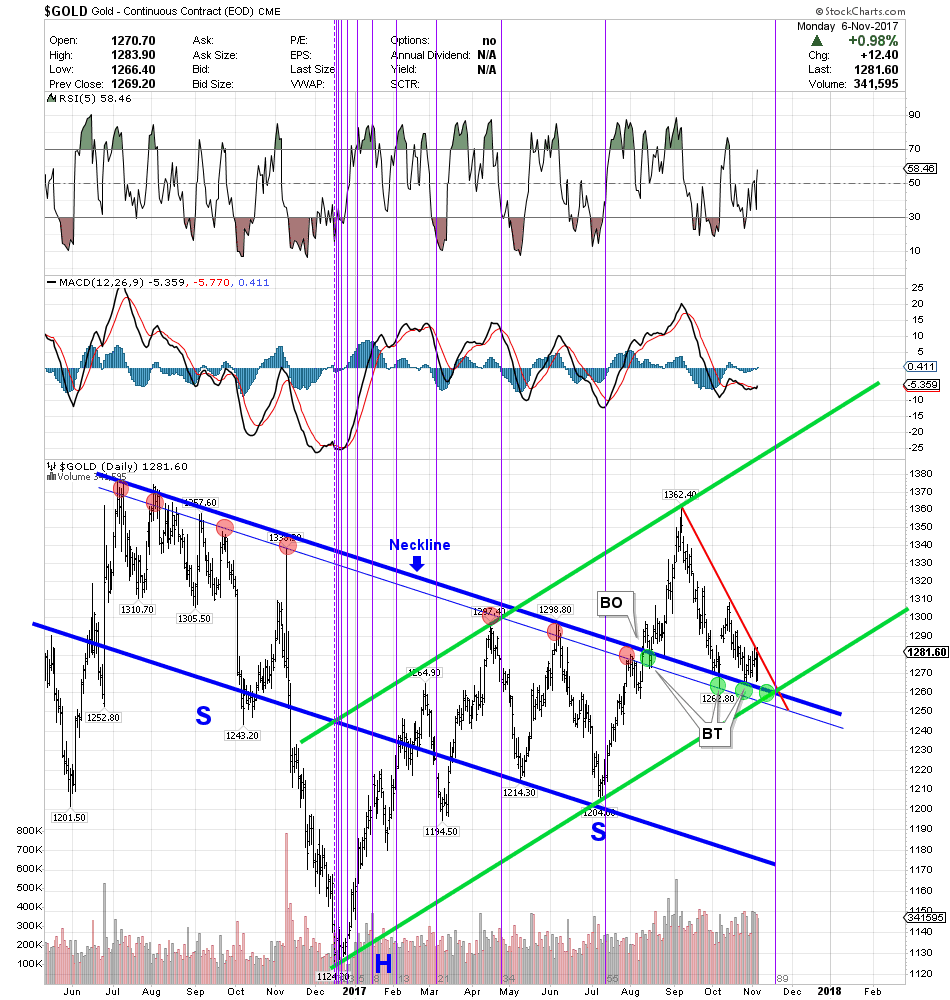
There is clearly a back-test going on right now, of the “Neckline” of a bullish inverted Head & Shoulders pattern. The pattern may be slanted but is still valid. We can observe how the Neckline served as “resistance”, consistently rejecting price (red circles) until August, after breaking out to the upside.
To confirm the upside breakout, and potential upside target of about $1,500, we would next expect to see the Neckline area reverse its purpose from resistance to “support”, which is exactly what has occurred since the August breakout (green circles).
As long as that continues, the only ingredient left is “time” – and would you believe it, as shown by the (purple) Fibonacci Time Zones, the latest 89 day cycle is set to end on November 17, 2017…just days away.
Note how accurately the Fib time lines predict market turns. It’s not perfection, in some cases several days off, but then – as I’ve often said – trading is “horseshoes & hand grenades“, not rocket science!
Nice Chart RTV !
Good chart there RTV. Nice work.
We are on the same page here.
And, as we know, it is also a BT of the 6 year now support line:
https://goldtadise.com/?p=414535