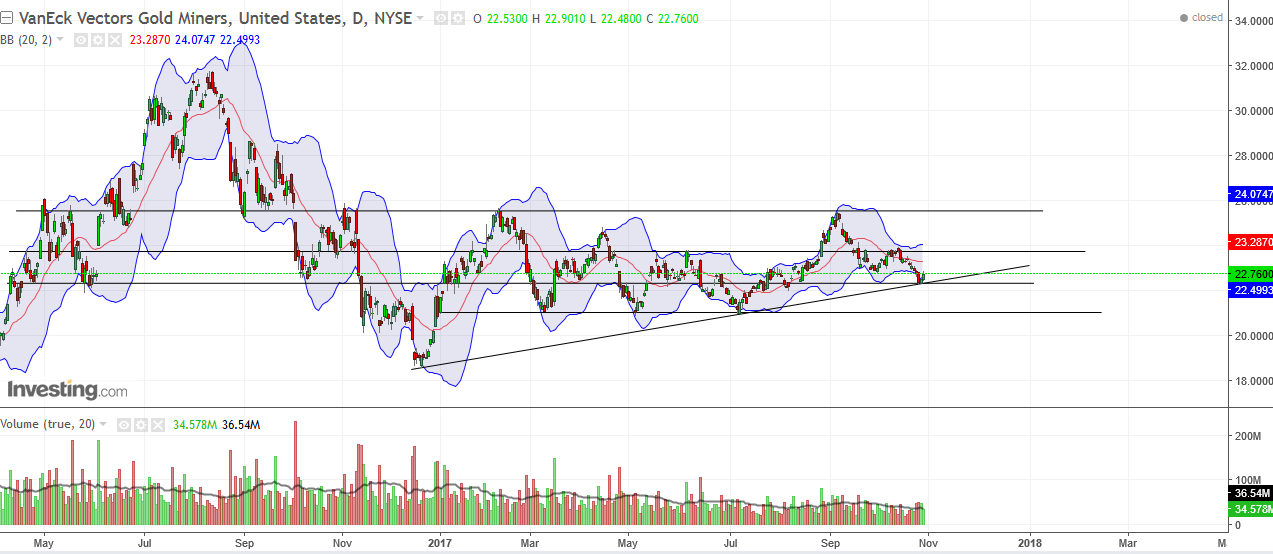
GDX Daily + USDJPY confirmation
Maybe it’s me, but I’ve never seen a daily chart of GDX drawn up like this. And it looks so right, so simple, so clean.
Friday was the BEST Risk:Reward you could have asked for, given these trendlines. Outside the lower bollinger band, sitting right on 2 trendlines of support. Beautiful. I didn’t recognize this on friday, but I still got long because Highroller’s chart helped me realize the risk/reward was most likely worthwhile.

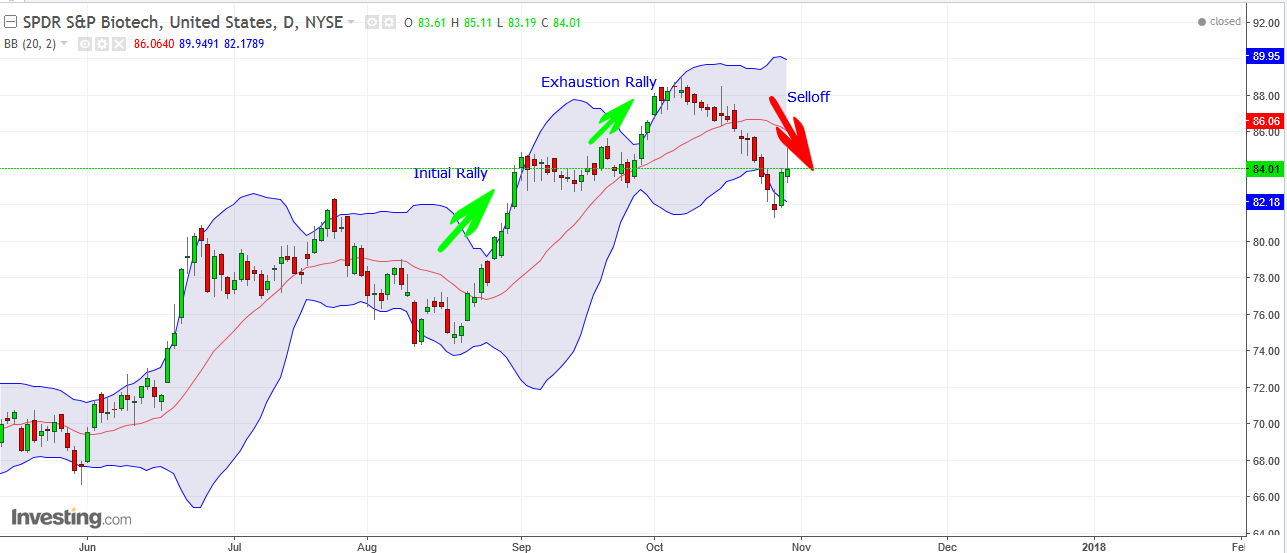
Meanwhile USDJPY completed the double top “exahustion rally” last week:

Why do I predict this for USDJPY? Because I’ve seen this pattern elsewhere:
glad ya took the trade, I had my head in the sand elsewhere, trying to re-align my thesis into others sectors which don’t need me at the screen everyday. Off to the sandy beach soon and don’t need the worry. 🙂