Hui flat correction
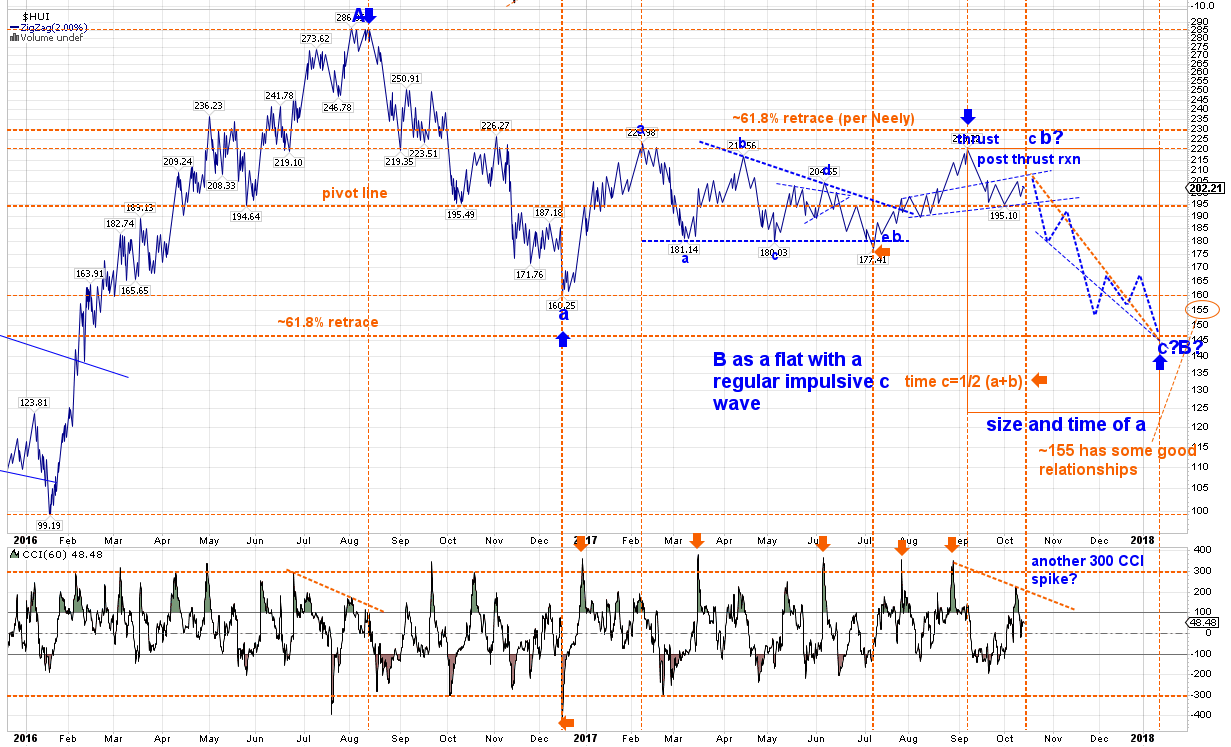
I’ve previously shown possible corrective patterns on the miners’ charts. This is a chart of HUI showing a target generated from a typical flat correction. The link to the forum where the chart appeared is
http://www.mexicomike.ca/php/phpBB2/viewtopic.php?t=17872
Dsquare and Navyblue are highly proficient in Elliott wave as interpreted under Neely guidelines and produce many good charts.
I’m looking at the 22.5 area for an initial Dust entry here.
The good news is that the HUI will probably exceed 400 next year