Long EW chart using all stock market data
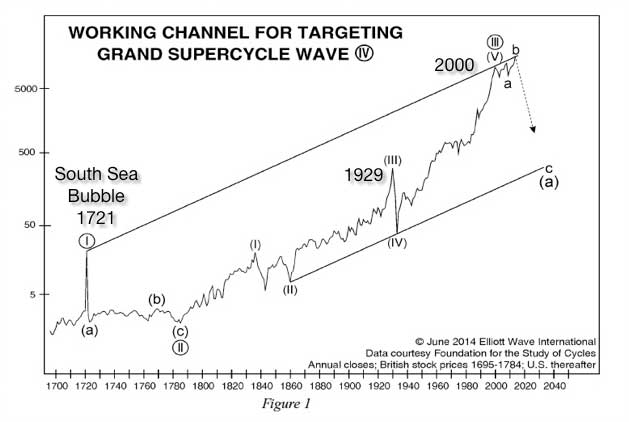
This chart uses stock market data from the market inception I believe. The key point is that the count suggests a move towards the lower channel line.
For something more useful to trade off and for those interested in Elliott Wave projections and cycles, here is a link to a Peter Temple video made about 8 weeks ago.
I liked the video but he lost me when he said this move from 2008 has been corrective. Weve literally gone vertical for 10 years.
It’s strange in a way but I think all he’s really saying is that QE altered the natural path of the market and since the move from 2009 is artificial it will be fully retraced as opposed to a partially retraced impulse. So it could play out as an expanded flat which squeezes out liquidity before the next impulse sequence up (or more QE)
Ranchida, are we at “b”?
His working assumption is that a large corrective B wave is about to end. Then a large C wave down.
The large B wave subdivides into an ABC (blue) and C should be in it’s final stages
Sam, whose work I post on gold from time to time, is also on a large B wave from 2009 for SPY. He is favoring a deeply nested count for its final c wave along the lines of my recent SPX post … and so he doesn’t see it concluding anytime soon because of the remaining 4/5 unwinds. Not before 2019 would be my interpretation. I still find portions of his count since Feb 2016 entirely credible.
Pretzel dismissed the B wave idea as ludicrous just recently in his forum, tossing it out in his mind after 2012.
Technically, B waves CAN make new highs …. but I’m not inclined this way myself. Not at prices 60% above the prior high.
Finally … QE is not new. Versions of it go back to the 30s. (See Wiki) So falling back on QE as a rationale for an “un natural” wave is absurd. We’re charting nominal dollars here, after all. As for the 3 waves down into March ’09, why not a truncation? PS – IMO, it was the suspension of FASB 157 on April 2, not QE purchases, that formed the bottom.
http://www.zerohedge.com/article/guest-post-extend-and-pretend-where-are-we-after-one-year-suspension-fasb-rules
QE1 began in November ’08 (MBS), so its difficult to see that being the basis for the turn.
Teller appears to see this C wave as an ending diagonal, and is looking for c up of 5 of C to conclude it, IIRC. Maybe with b down incomplete, not sure.
For the record, my own (non EW) work flatly doesn’t support a near term top. Not before yearend, if then. Both James Goode and Joe Taverna are both looking at us nearing just the end of a FIRST wave.
To those whose heads are spinning from all these counts … this is why I prefer using my own tools FIRST, and multiple EW options as a reference. Too many reasonable ALTs from EW. But EW is invaluable because it can warn of POTENTIAL reversal points (and in surprising places) if you can establish a count that is tracking well. Sometimes you can’t. The trick for me is disqualifying counts that prove wrong. EW is not the holy grail.
I track QQQ which is potentially in wave 5 in an ED on the daily. The most likely target for pattern completion is 150.4. If 153 is exceeded then the pattern and presumably entire count are wrong.
There are additional indicators I use which show weekly negative divergence indicative of a possible intermediate top.
I’m only looking at what I believe is a good trade set up not necessarily the final high. It’s simply a low risk high potential entry which may develop into a large position later.