HL – Daily
Someone posted a chart on HL recently, and it reminded me to take a closer look. I focus mainly on futures, but I’m starting to accumulate Jan ’19 calls on HL, a strategy which turned out to be a 20-bagger for me during the baby bull run in 2016.
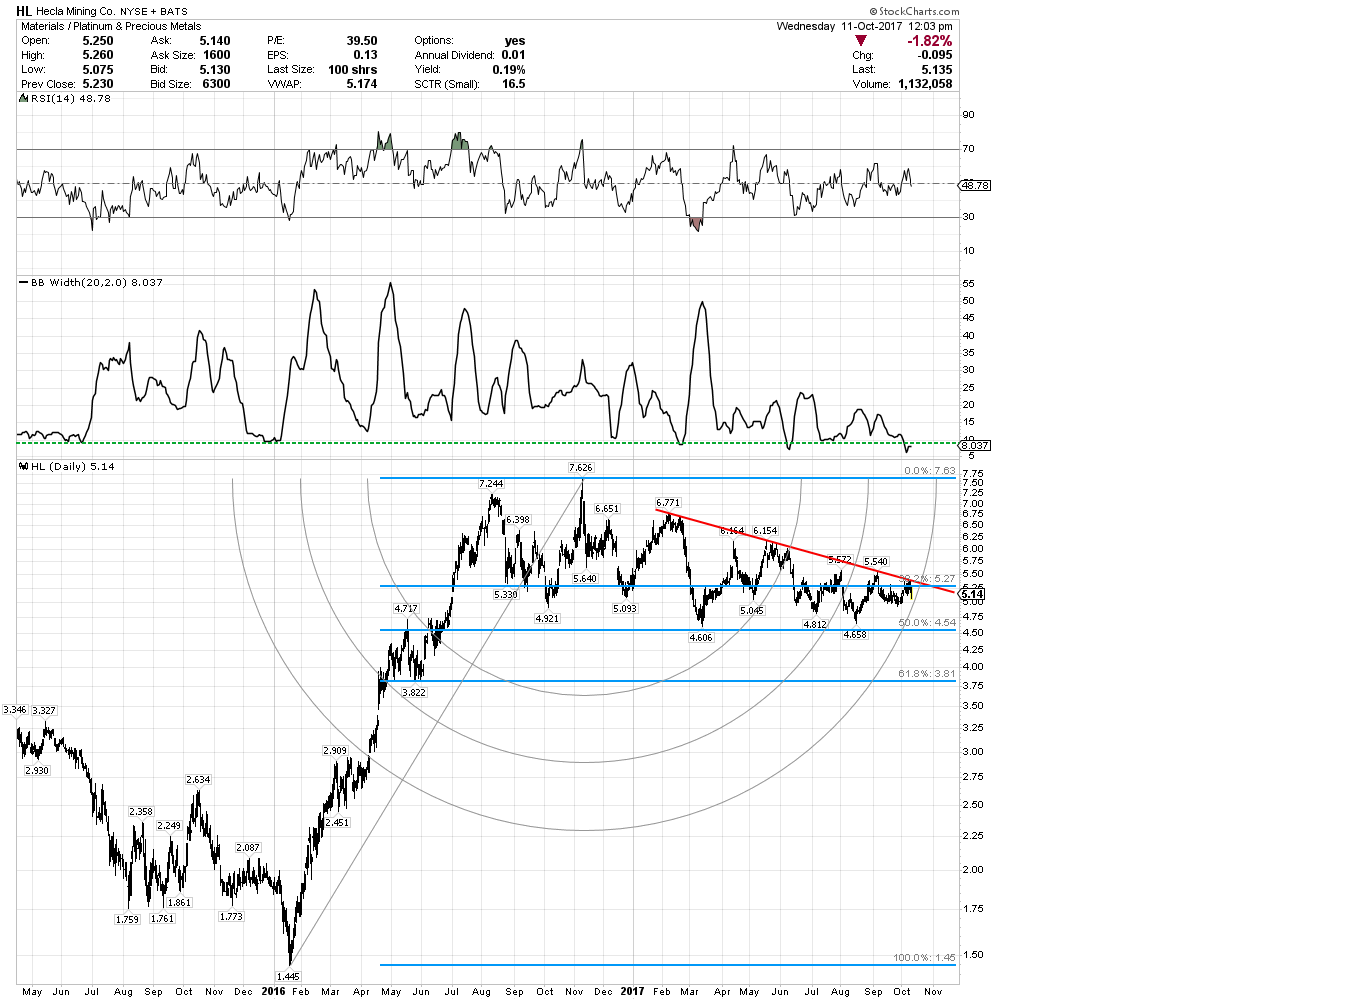
If any are familiar with my charts, I am a big proponent of “time” analysis, especially with regard to Fibonacci. In the daily chart below for HL, we can observe via the (light grey) Fibonacci Arc how HL has put in its time grinding sideways since peaking in late 2016.
More importantly for me – is the Bollinger Band Width indicator – which recently made a major low, reflecting a “tightly coiled spring” that indicates the mind-numbing sideways price action is coming to an end soon and an accelerated breakout trend (up or down) is imminent…
Definitely due for a break out. Based on the way the PM markets trade it seems likely the first move will be counter to the ultimate resolution – eg a big gut-wrenching break to the downside before a run up, or vice versa.
Velly Intellesting …thanks RTV
PS…I vote “down”….everything PM is looking down to me
Yearly lows in December …like clockwork
Hope I am dead wrong
I hope you’re right. I’m just starting to accumulate and would love to buy more cheaper.
Why is there revenue dropping yoy and turned a .06 EPS gain into a .06 EPS loss? just on the surface my guess is down…
they are a low cost producer. note how they didn’t tank anywhere near like majestic or others in the sector. when the sector takes off HL will go ballistic, just like it did in 2016.
Wait for $4.65, buy Jan 2018 $5 calls under 25c, then buy March 2018 $7 calls for under .07
i would have no problem buying calls at that level but don’t like short term calls – its a sucker’s game.