nudder view
fBy Tim Ord of The OrdOracle
- SPX Monitoring purposes; Short SPX on 8/30/17 at 2457.59.
- Monitoring purposes GOLD: Long GDX on 10/2/17 at 23.05
- Long Term Trend monitor purposes: Neutral.
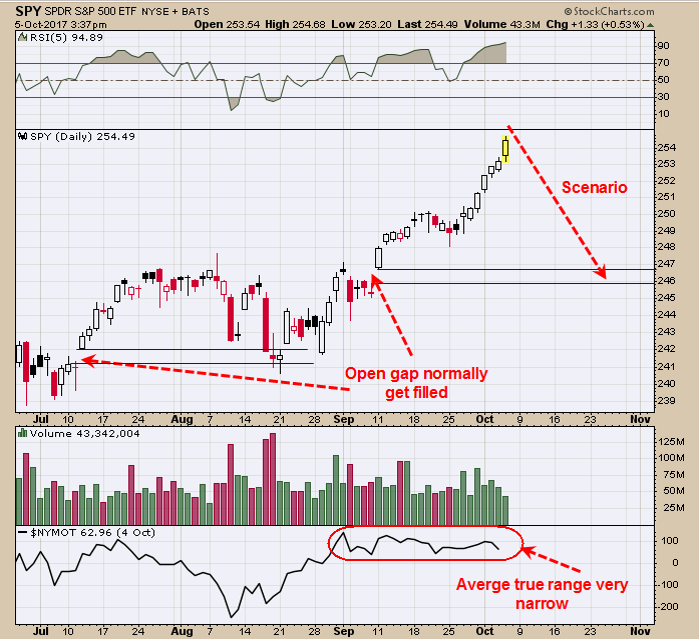
The top window is the 5 period RSI which did reach above 95 today and extended (more on that on page two). October has been down in the years ending in 7 going back to 1907. October 5 is also the Harvest full Moon which is somewhat rate – the last one in 2009 and could have an affect on the market. A gap formed on September 11 and most open gaps get filled at some point; which is our down side target. Previously we had a target to 2400 range which appears off the table for now. The gap in July got filled in August (see chart above). Short SPX on 8/30/17 at 2457.59.
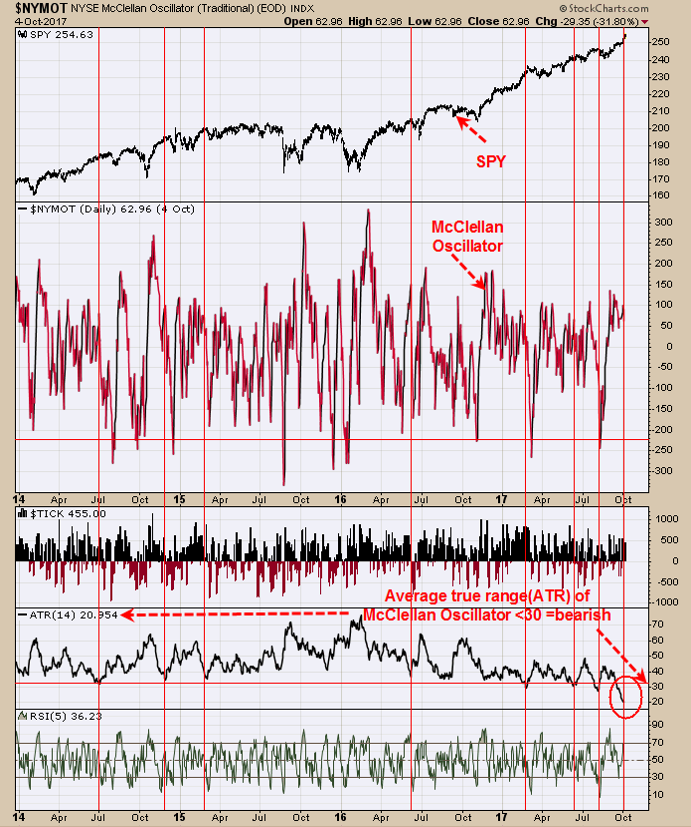
An unusual market.What we though were going on did pan out. However, a high of some sort is not far off. The second window up from the bottom is the “Average True range” (ATR) of the McClellan oscillator.Normally when ATR of the McClellan Oscillator reaches below 30 the market is near a short term high (identified with red vertical lines). Current reading is 20.954 and the last time it was this low came at the 2000 top. We don’t think a top like 2000 is in the cards but does suggest a top is near. Another interesting statistics is the five period RSI reached 95 today and the last two times the RSI reached this level came in March and November 2010. The March time produced a sideways market for a week and the November time frame produced a decline that lasted a couple of weeks (credit to Urban Carmel on Twitter). Short SPX on 8/30/17 at 2457.59.

Over the past week GDX has made lower lows and GDX/GLD ratio has made higher lows and a positive divergence (third window up from bottom). The Up down Volume percent indicator and the Advance/Decline Percent indicator (bottom two windows) both showing strength and have matched their previous highs and suggests GDX should also march its previous high which is the September 25 high which is 23.87. We have a target of 24.20 which is the September 20 high which was a high volume day and most high volume days high are tested. If the September 20 high volume day’s high is tested on light volume would suggest resistance and market could mark a turn down. This scenario may change and condition change in the market. Long GDX on 10/2/17 at 23.05.
Thanks, very interesting indicators you use.
I “endorse” this projection!
just noticed on my post it notes that Armstrong had oct 09 as a benchmark date which coincides with jim sinclairs benchmark price of 1278. gold closed at 1278.90 . Don’t know why or what it is all about but strange. Perhaps it closed 90 cents above threshold and all ok??