Gold in C$
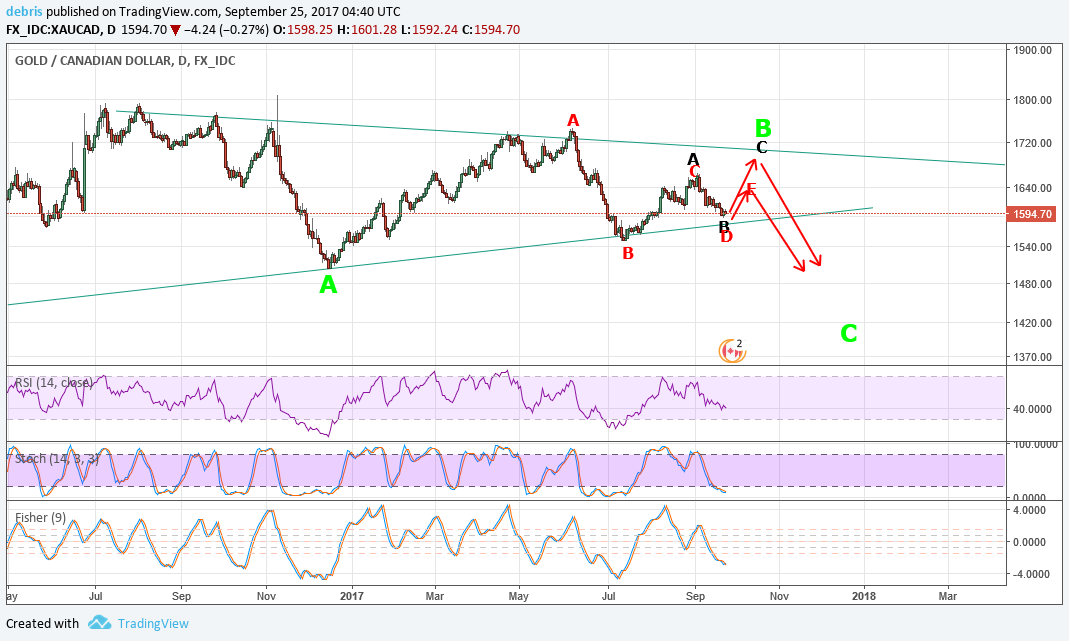
One last chart to show a count on gold in CDN$. The red count suggests green B is a triangle and the move ends at red E at about 1635.
The black count suggests the trend line around 1700 could tested.
I believe the red count is more likely. After that the larger structure should break down and trend lower.
The next Bradley date is December 1st and could be an important low. The last Bradley was September 7th which called the turned perfectly. The one before that called a turn to within a day.
Thanks for your thoughts.