Fibonacci Time Cycles & PMS
Well, it looks like this Monday or Tuesday is going to be very interesting for PMs, according to Fibonacci. I believe it was W.D. Gann who said:
“Time is more important than price“.
We certainly have some cycle whiz’s posting here, but I notice that most of that analysis is based upon average daily, or weekly cycles, or otherwise semi-annual, annual, and multi-year cycles, without any acknowledgment to Fibonacci time cycles. Thus, cycles that become extended, shortened or even inverted are justified by almost any other cause and effect. Yet, it was W.D. Gann who once again reminds us:
“My calculations are based on the cycle theory and on mathematical sequences…”,
and,
“Every movement in the market is the result of a natural law and of a Cause which exists long before the Effect takes place and can be determined years in advance…”
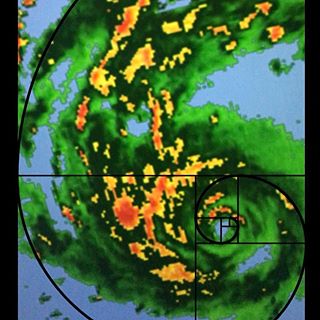
So, if time is more important than price, and Fibonacci is the mathematical sequence underlying all of nature…could it be that Gann was indirectly referring to Fibonacci time cycles as the basis of his calculations? (see how Hurricane Harvey unfolds in accord with Fibonacci perfection)
If so, then it seems to me that at least a “hat-tip” should be given to Fibonacci when engaging in cycle analysis. To that end, I am going to start off with a stripped down version of my (fib-cycle) chart for GDXJ – which shows just the first fib-cycle set at the bear-market bottom, for junior stocks, in early 2016:

I’m going to challenge the record of any cycle analyst to compete with Senor Fibonacci. While it’s not perfect, it’s pretty damn close – and I would suggest where one could argue that it is “off” – it rather denotes a period of “neutrality” rather than a recognizable trend. Remember, there are 3 price movements – up, down and sideways. If this site allows, you can go back and read my late December, 2016 post where I (or rather Senor Fibonacci) call the December bottom to the day.
As time unfolds, and daily or intermediate cycle bottoms appear, additional fib-cycles are added…but for the chart below, I’m going to add a new fib-cycle for only the major bottoms in late 2016 bottom, and May 2017:
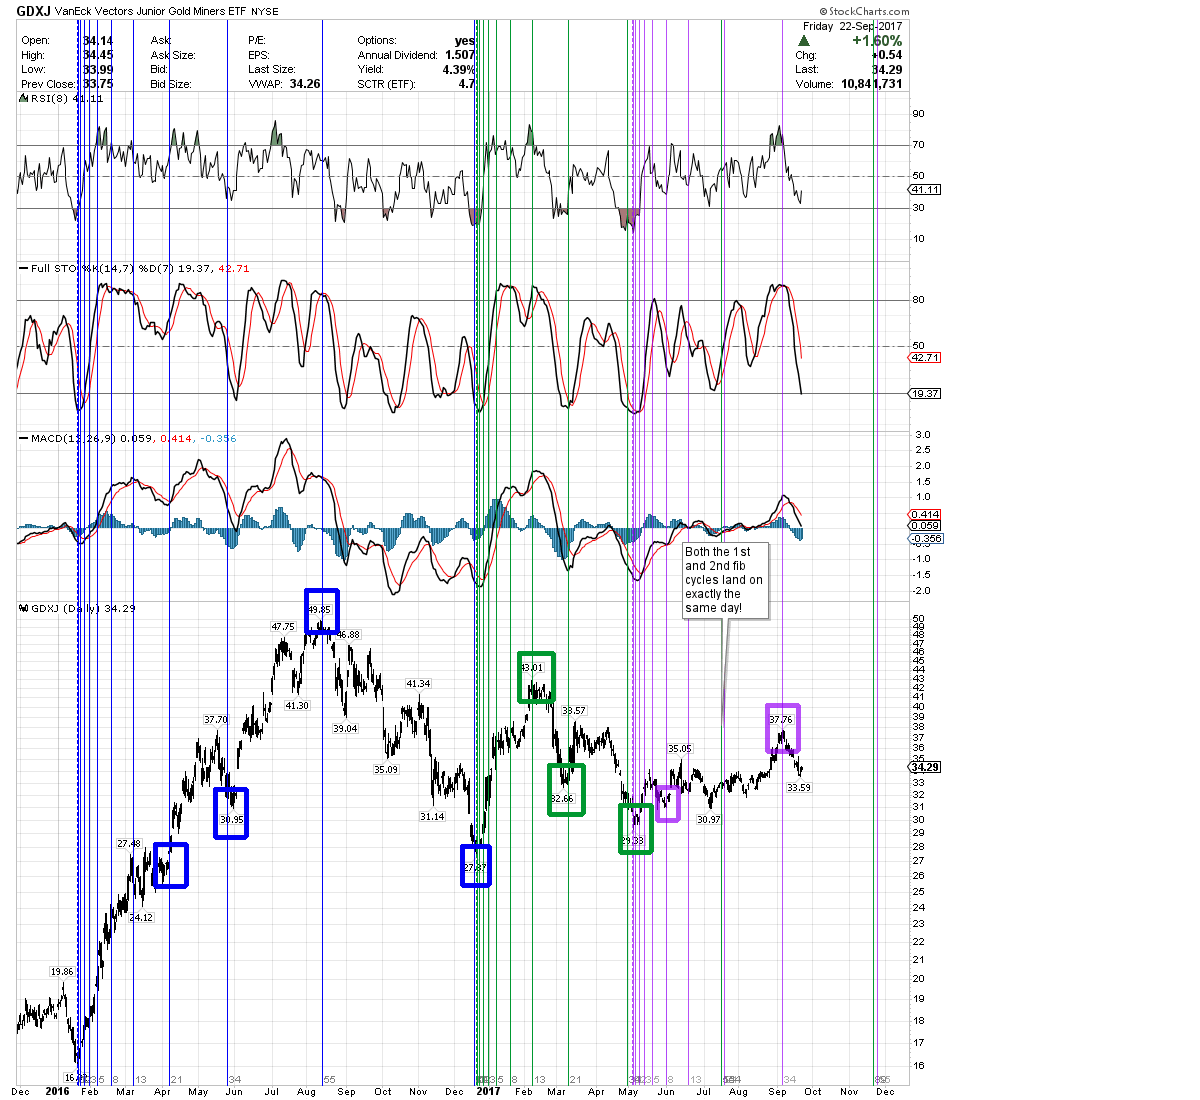
Once again, it sure looks like Senor Fibonacci is driving the bus here, just like he is for the rest of nature. Looking ahead – we see the convergence of the 2nd & 3rd fib-cycles coming together in early December, right about where “traditional” cycle analysis would expect the 1-year cycle low.
For perma-bulls: Am I saying that PMs are destined to trend lower all the way into December, just as the Fed is planning to hike the interest rate? No – I’m not “saying” anything! I’m merely placing lines where price instructs.
Of course, the price charts for Gold & Silver are similar, although for Gold & Silver – their major intermediate bottom (I assume) landed in July. For that reason, I will add one more fib-cycle to GDXJ, at its July bottom:
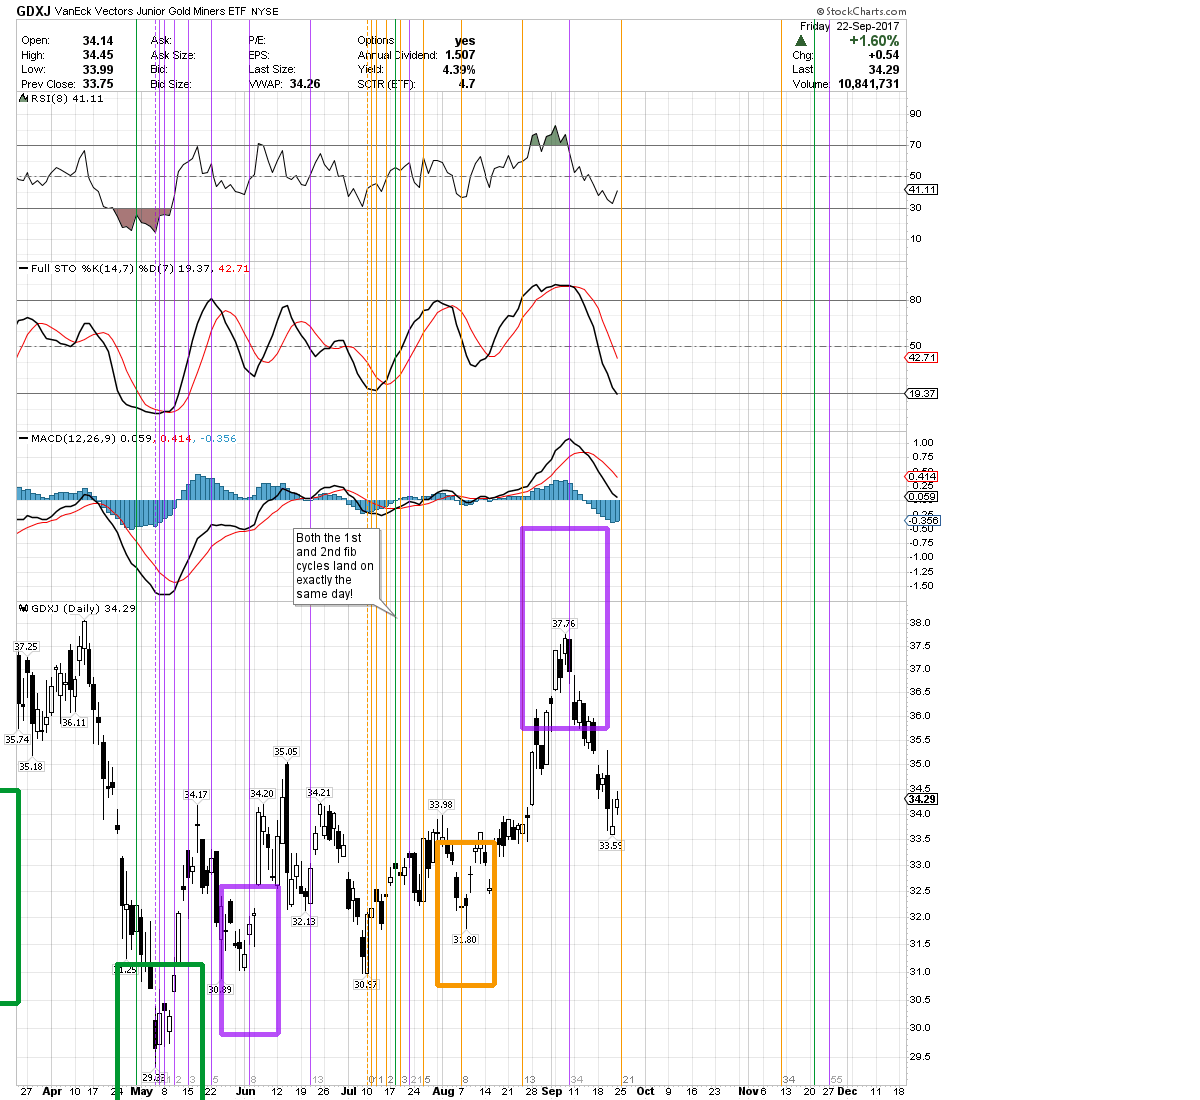
Which brings us back to this coming Monday, when the latest 21-day fib cycle ends. After that – it is “open air” time-wise until mid-November. Certainly, the perma-bulls could argue that a reversal is in order – and I wouldn’t argue with that. I covered my short positions yesterday.
But its hard to ignore how the fib-cyles are lining up – like raindrops forming concentric circles which flow into larger cycles of water that eventually end into the sea – to what appears to be a major bottom looming towards the end of the year, right in line with the 1-year cycle low proffered by “traditional” cycle analysis.
Very interesing,
Thanks RTV
you’re welcome!
Great write up RTV. I really should spend more time learning about Fibonacci – I remember studying the theory back in school days and it appeals to my way of analysing the mathematical aspect of markets and their link to natural processes. A December low of some kind is very much on my radar.
thank you! the nice thing is most charting software does the work for you…
I was thinking exactly that-you and RTV should really get together-or at least compare notes:)
Good stuff RTV
tx fully –
btw, you have a nice ass!
🙂
Thanks.
I hope you make these Fibonacci charts a regular feature at Goldtent.
I’m sure others would agree.
Please keep us posted RTV. Great read.
Thanks for this. I’m wondering, with each new time period, the expectation is that price changes direction? Whether it be upwards to side/down, or vice versa.
Thanks
Nick –
You’re talking about 2 different things right? Price unfolds over time in accord with nature, like a flower – although strictly speaking, Fib cycles only deal with time. But I think you’re on the right track. When writing about time being more important than price, W.D. Gann also said:
“When time is up, price will move.”
So when time is up, it is up to you to consider price movement within the larger context of “price action”. Has price been locked in a downtrend, or an extended rally? Trading sideways? What is the long term, intermediate, daily trend? Are indicators oversold/overbought? positive/negative divergence? You know, the usual stuff.
Put it all together and you should have an idea of what to expect. If nothing else, being in tune with nature, knowing when the cycles occur – will serve as a heads up for potential price swings one can profitably trade.
Yes I think you answered correctly. I was wondering what to infer when the current time period comes to an end and a new one begins.