gdx
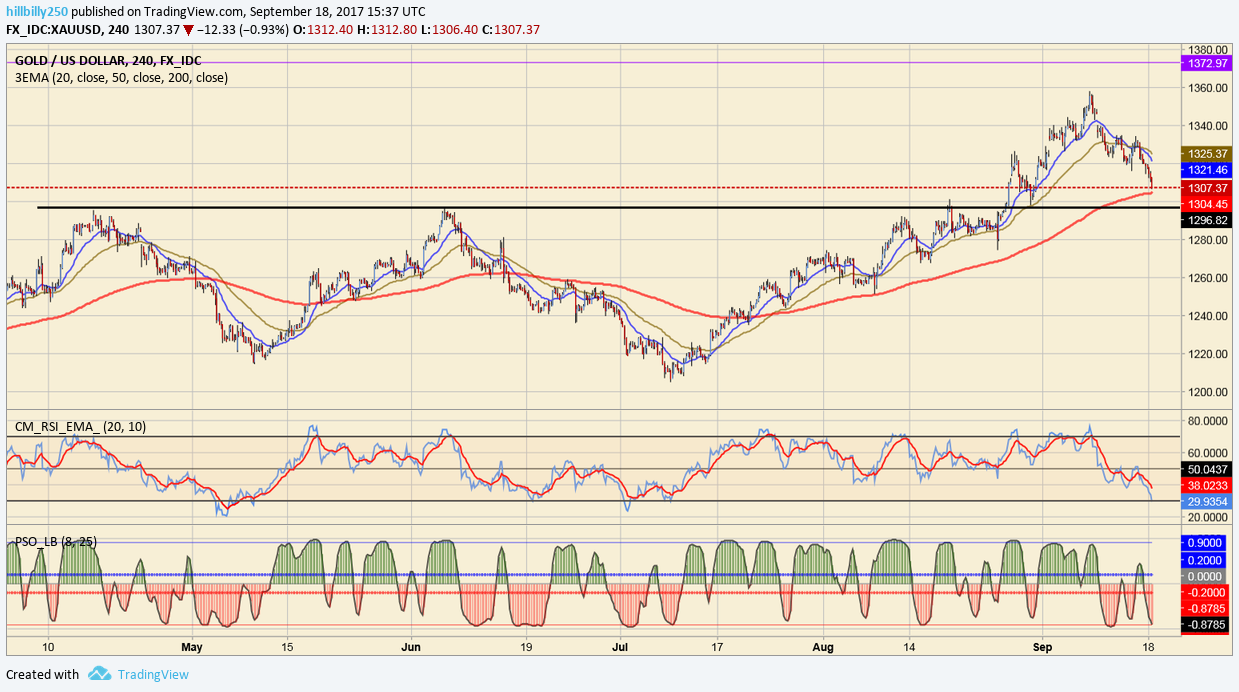
4hr gold looking like 1300 line in the sand
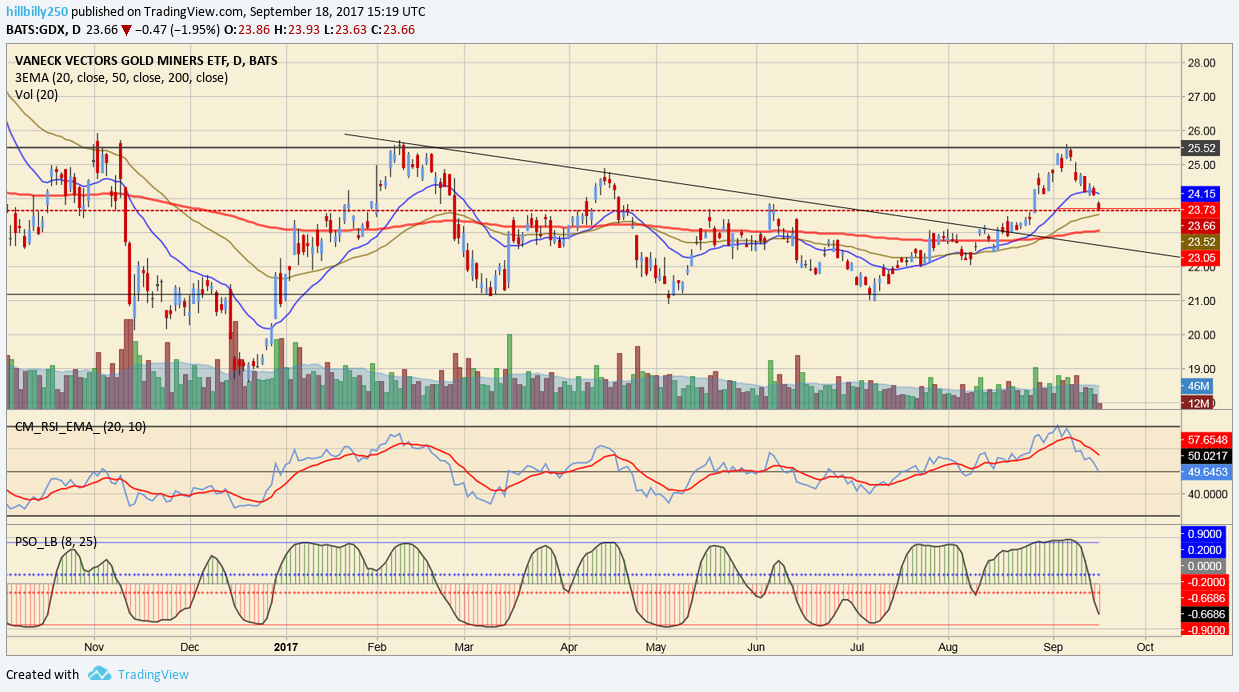
daily looks like down to the 200 line with rsi/ema crossing below 50 line= more downside
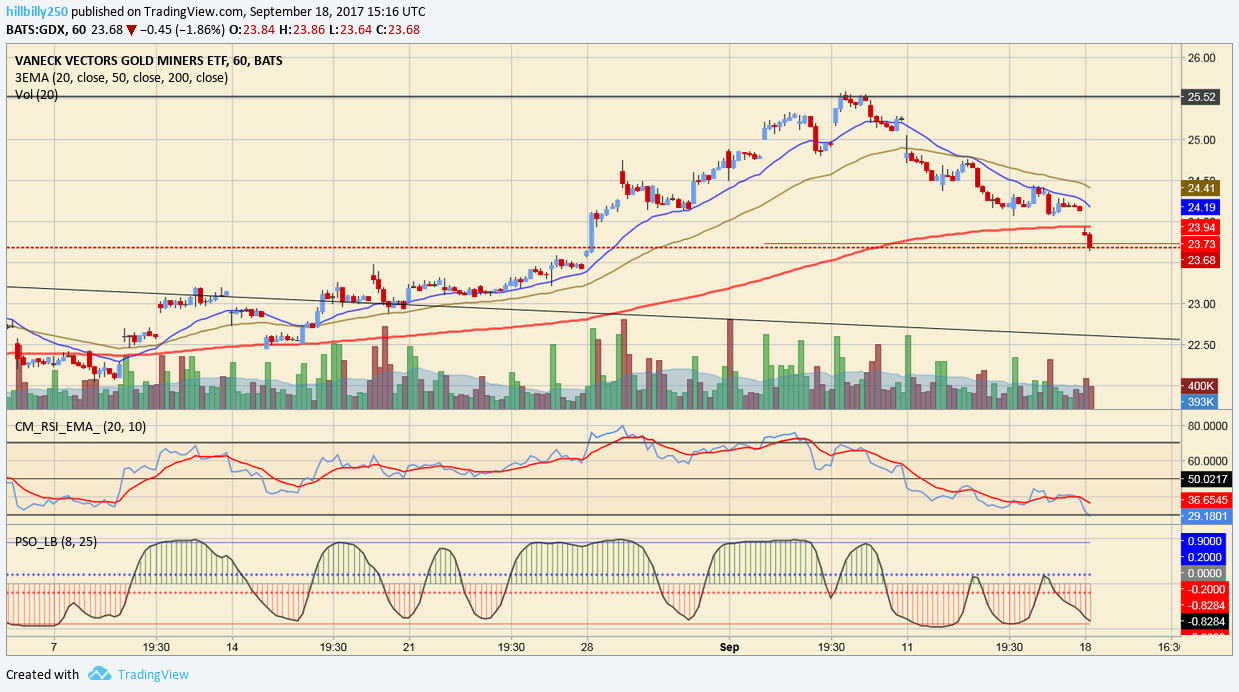
hourly chart, rsi/ema still far apart so more downside
4hr gold looking like 1300 line in the sand
daily looks like down to the 200 line with rsi/ema crossing below 50 line= more downside
hourly chart, rsi/ema still far apart so more downside