gann fans
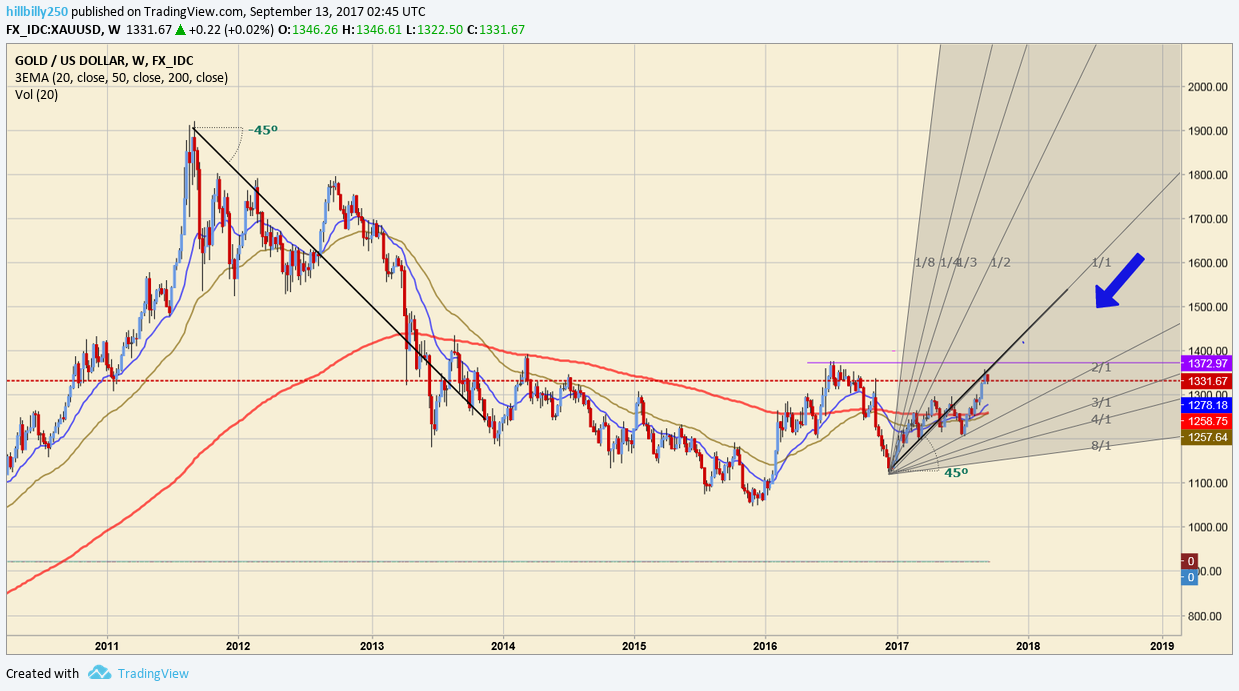
2017 important low showing resistance and support.

latest bottom point showing immediate channel of support / resistance
off of the low showing above channel and into the new zone area mixed with the top fan. Blue line would be busy inflection point so therefore should be noted as an important spot.
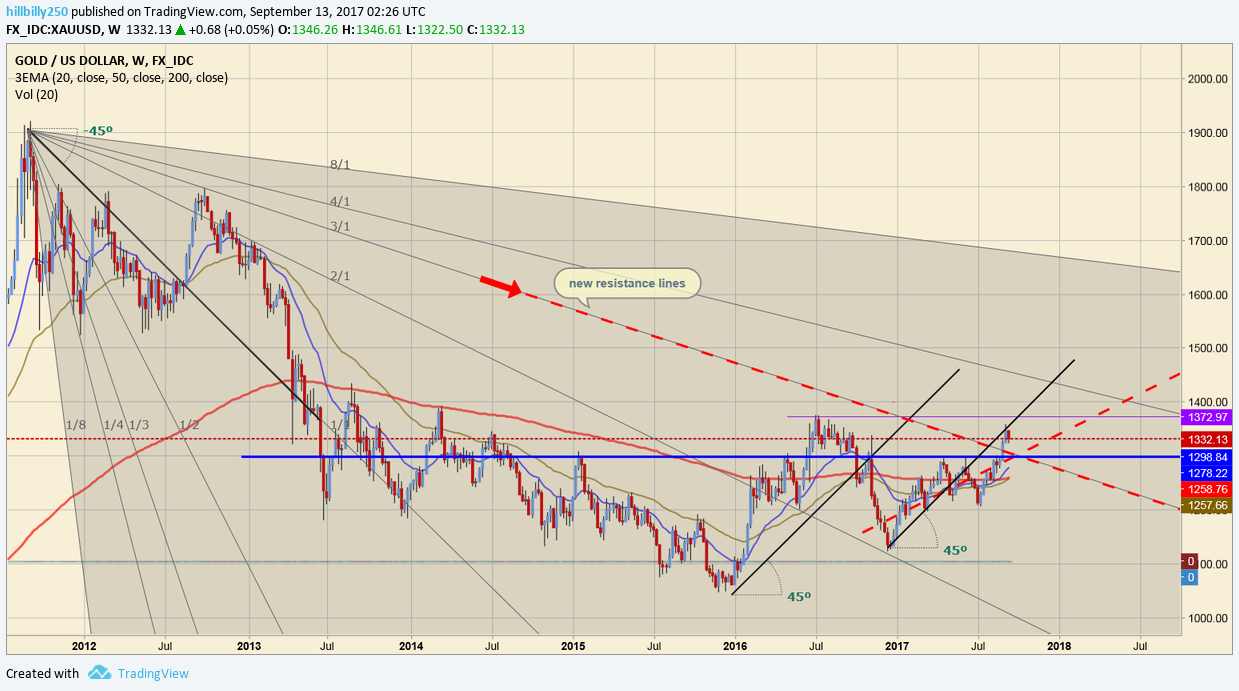
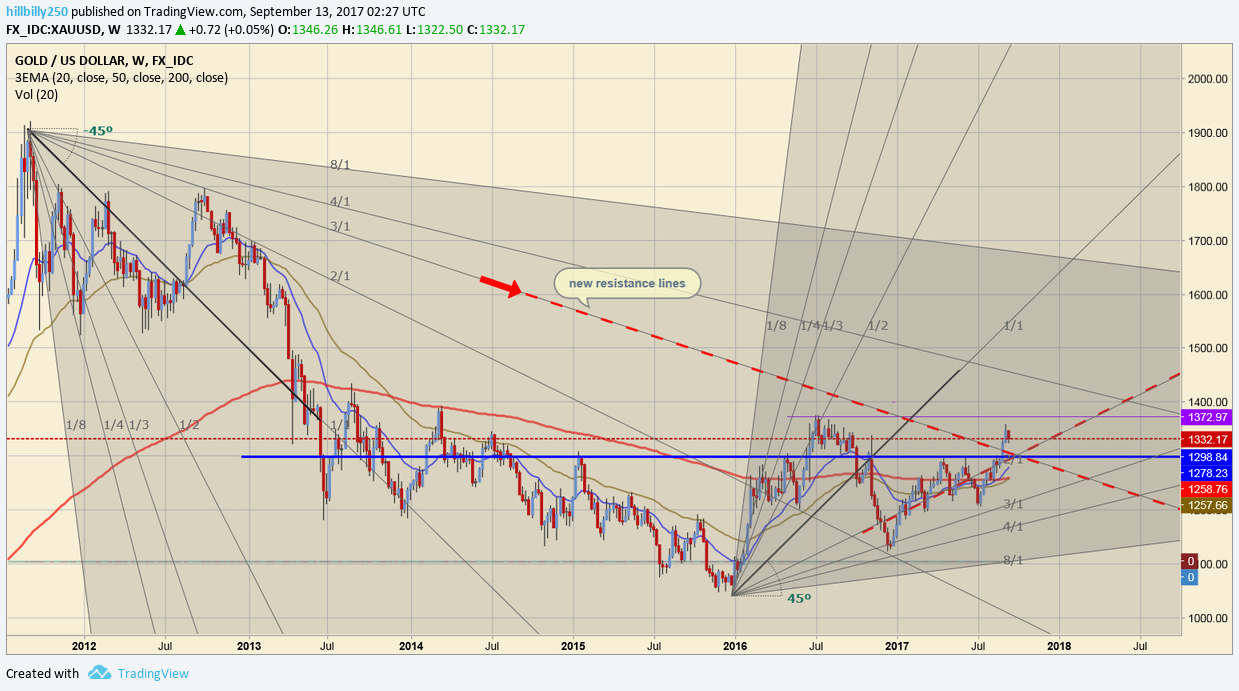
from the 2012 high showing fan channels, appears we are into a new zone. I assume this one chart should be the main one to follow progression ahead. I will keep an eye on this for future updates.
One can add a fan downward from the july 2016 high to give more channels I guess. It can go on till the cows come home obviously. Just learning this and and open to input of any, just kinda spooky how they line up like the fib circles in the last post. Perhaps a fib circle overlay! ?
Thanks, lock your piece scale.
Fat fingers, that was price scale.
Very nice, thanks. When I was reading how to use the fib arcs, I read to put the points on a major high & major low, hence I put them at the 2011 high and 2016 low. Not sure how efficient these type of tools are on smaller trends. Just my immediate thought. Could be wrong.