US DOLLAR
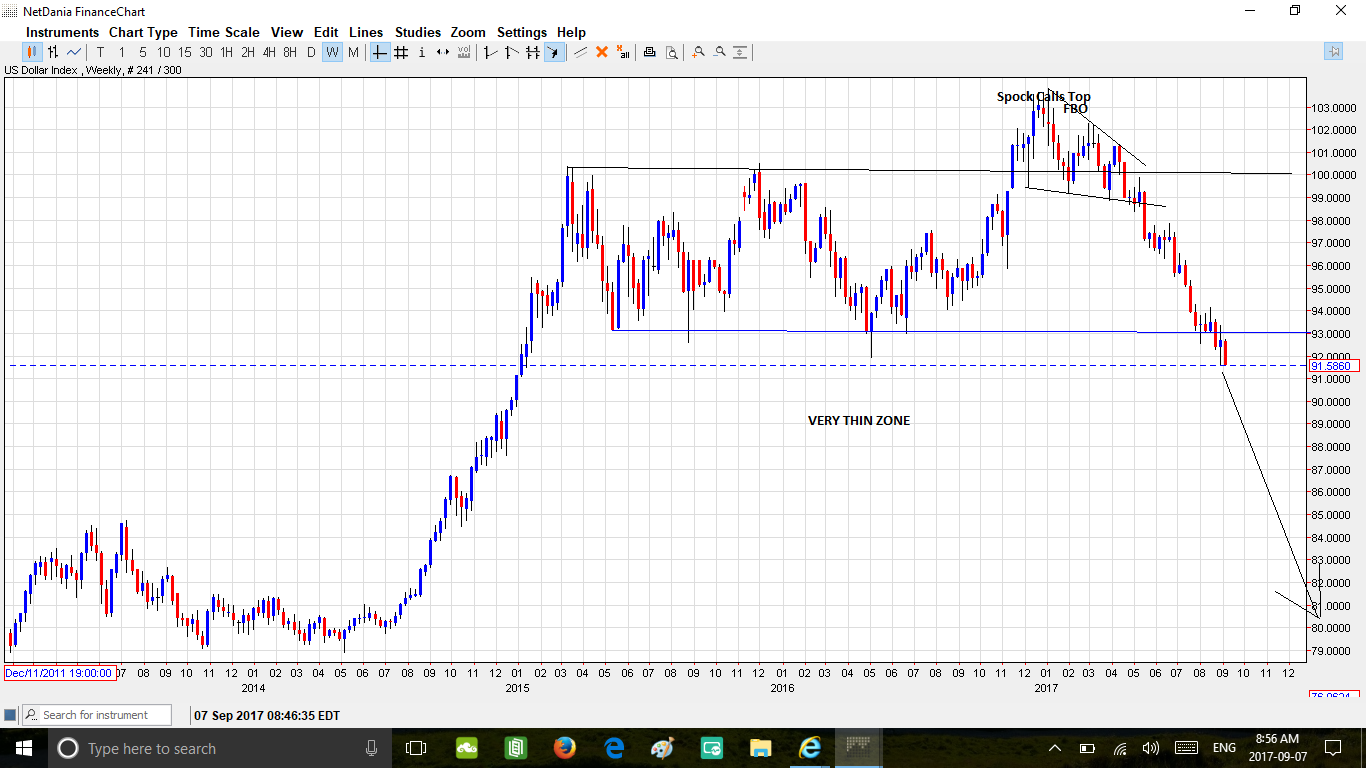
In the thin zone.
Spock predicted this 9 months ago and posted the Dollar Top based on long term cycles at Spock Miner Matrix .
$USD is toasted
……………………………………..
?December 21, 2016; 2:03 pm? Spock
it concerns me when chartists do not consider the underlying market cycles that are at play. the market is a living animal and therefore has a cycle, like breathing, that waxes and wanes. and within each major cycle are harmonics. A 2:1 harmonic is one example.
it also annoys me when folks cannot see the fragility and anti-fragility (convexity) at play.
For example, The US dollar trade weighted index, chart below, observations:
1. its fragile (concave) so one should be short
2. there is 2:1 harmonic at play
3. one cycle is 15 years (based on 2:1 harmonic of 30 year cycle off the 1985 high)
4. The other harmonics are 7.5 yrs and 45 months (3.75yrs), using 2:1 harmonics
So as an exercise, have a look at the chart below. Working back from current price end 2016, using periods of 45 months, 7.5 years and 15 years…what do you discover??
Now what does that observation mean? what is the most probable outcome right here and NOW?? Remember, these cycles do not change, and /or invert
(chart for members)
………………………………
I did not see this coming…that rally in the Dollar in 2014 and 2015 was so powerful I was sure it was the beginning of a long term uptrend.
There is nothing on this chart to support that thesis !
Spock had it nailed. Graddhy too. Their evidence tallied with my own thoughts. Looks bad for dollar bulls.