Weekend Observations
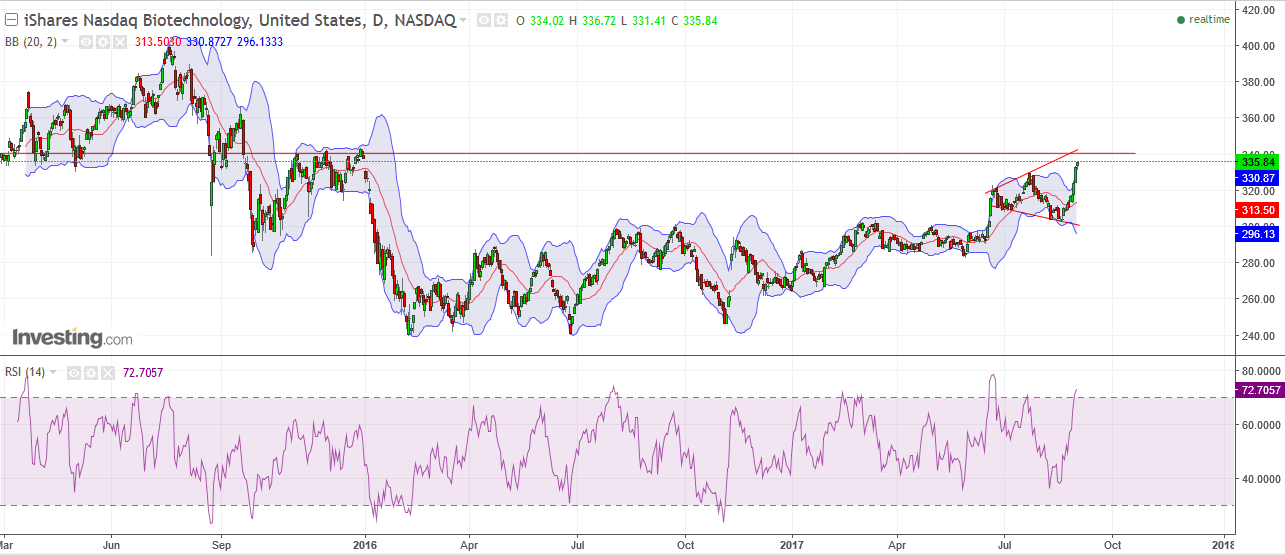
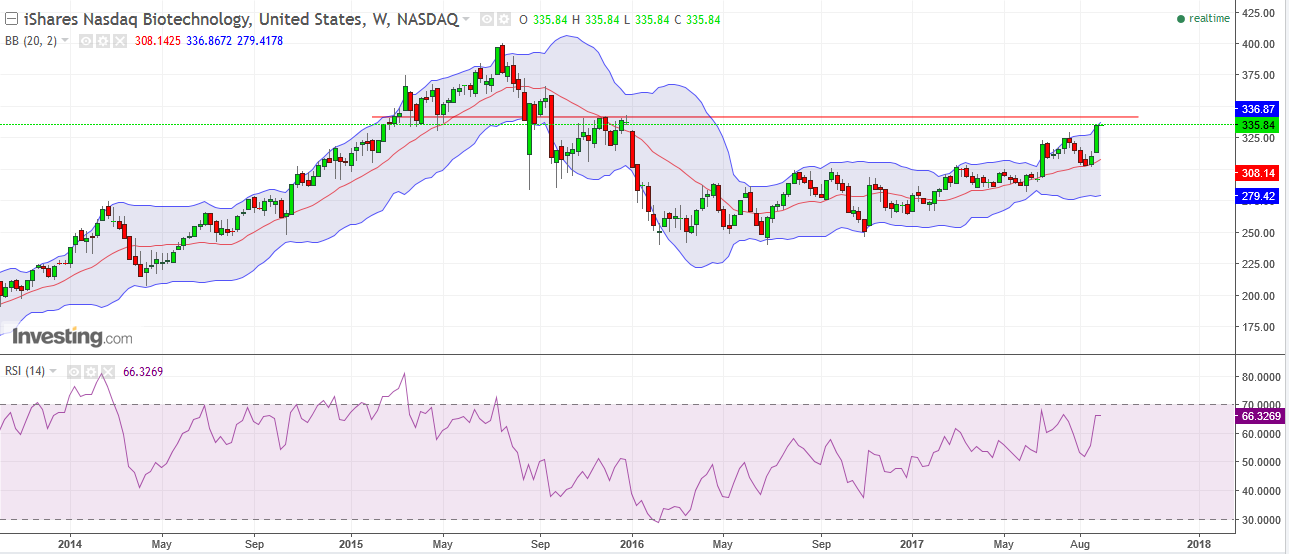
IBB starting to look overheated on daily & weekly. Big resistance at 340ish. RSI overbought. Outside upper bollinger on daily(short term sell signal). Might get a LABD trade this week. To be clear, I’d be waiting for $338.00+ (still 1% above friday’s close) to initiate a short, in order to minimize risk.
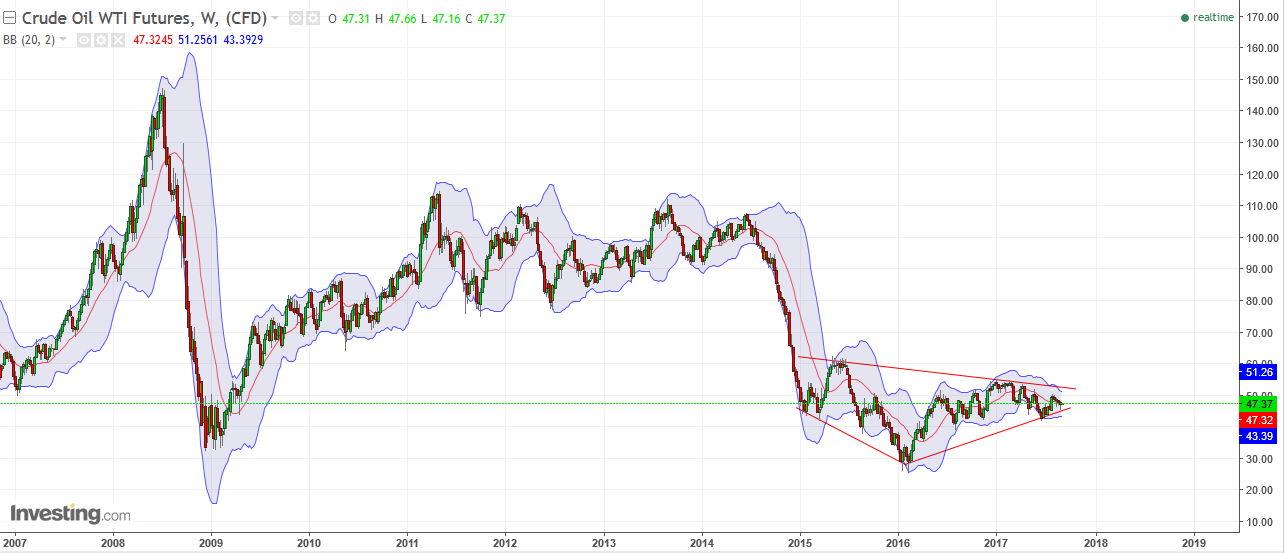
Crude oil – the next long-term breakout/breakdown looks near. Bollinger bands are tightening, and price is holding above the middle bollinger band on the daily & weekly charts, which is bullish. Close below $45 = breakdown. Close above $52.50 = breakout. I’d put my money on bullish but I’ve learned to wait for confirmation.
Gold/GDX (no chart) seems like no man’s land at the moment. It looks like it could go $15-20 in either direction. No *major* support/resistance nearby. BUT seeing how this is a brand new breakout and the bollingers are just starting to get blown wide open, I forsee short term dips being bought. USDJPY mentioned below looks iffy. We’ll have to see which one leads.
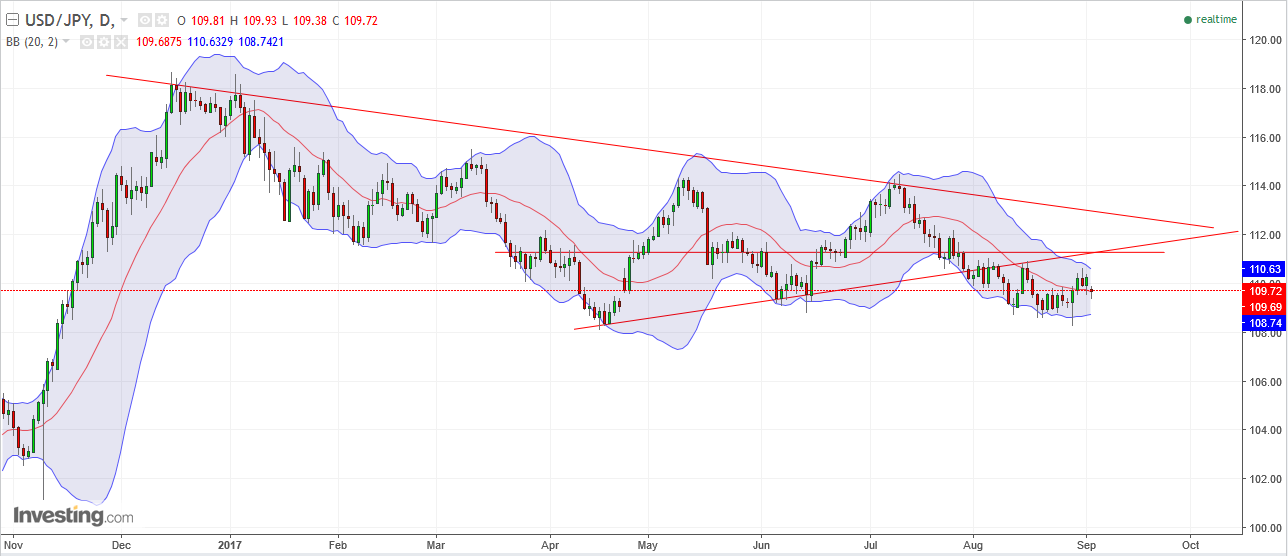
USDJPY – for the short term, it looks like it wants a bounce higher. Price has been holding the mid-bollinger for the last few sessions, including today’s “Nuke test reaction session”. That’s bullish. My line-in-the-sand here is going to be a CLOSE above the two red trendlines at ~111.30. I’m sidelined until we get there, or until price continues definitely lower.
Compute the value of WTIC in Jan 17 USD terms it’s a lot lower compared in Erou, $CDN, Yen terms. Look at the any gains in the US SM or Gold in the same context Gold is holding its own but the US SM is anemic.
I’m thinking WTI maybe ready for a bounce if not look out below.