Dollar Yen Monthly & weekly
A rare look at an very long term chart of the dollar yen, and my interpretation.
I love bollinger bands – in my opinion, they’re one of the most helpful & trustworthy indicators out there.
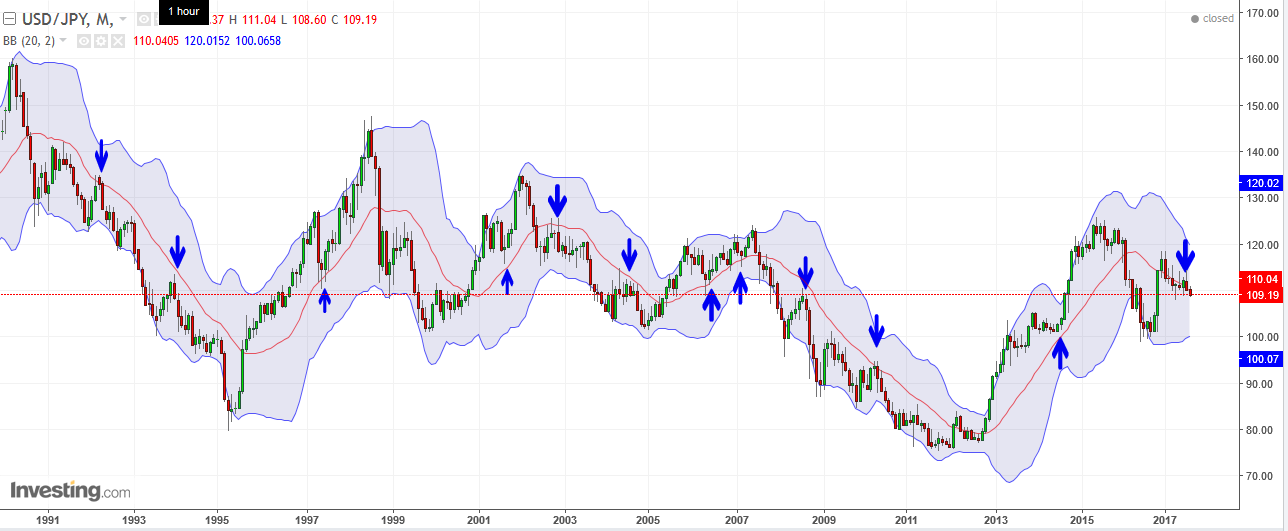
A monthly chart of USDJPY is below. As far back as the data goes, you’ll notice USDJPY has a tendancy of “acknowledging” or “respecting” the middle bollinger band. That brings me to my observation. You’ll notice the currency has been hanging on to the middle band for dear life since Feb 2017. This current monthly candle seems to be giving it up – at least for now. We’ll see how the month finishes. But if it does continue to fall, the next monthly support I see is around 105.00
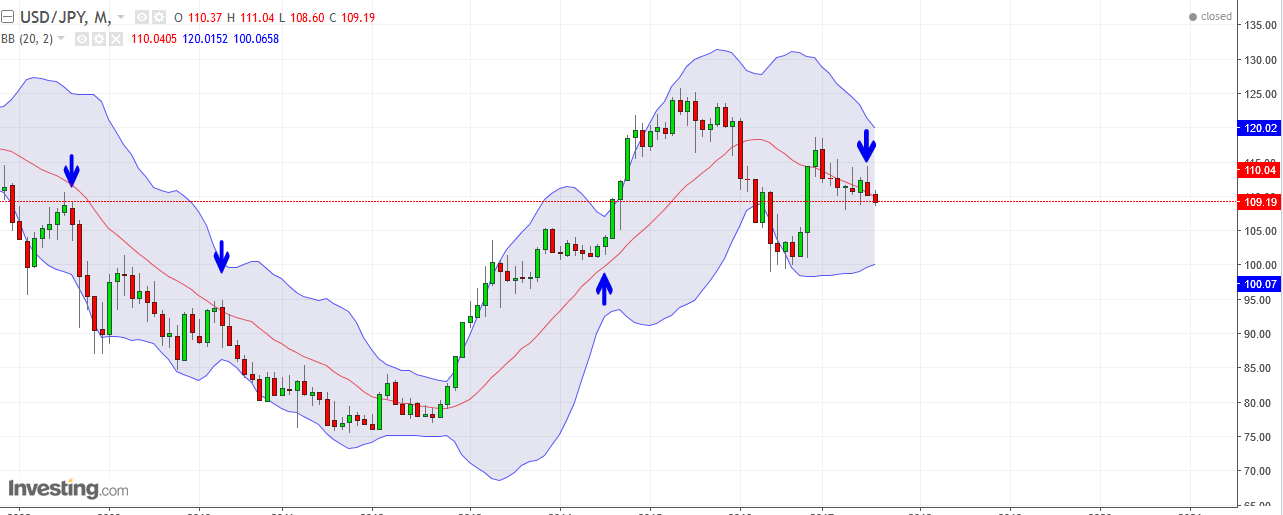
^^ A closer look ^^
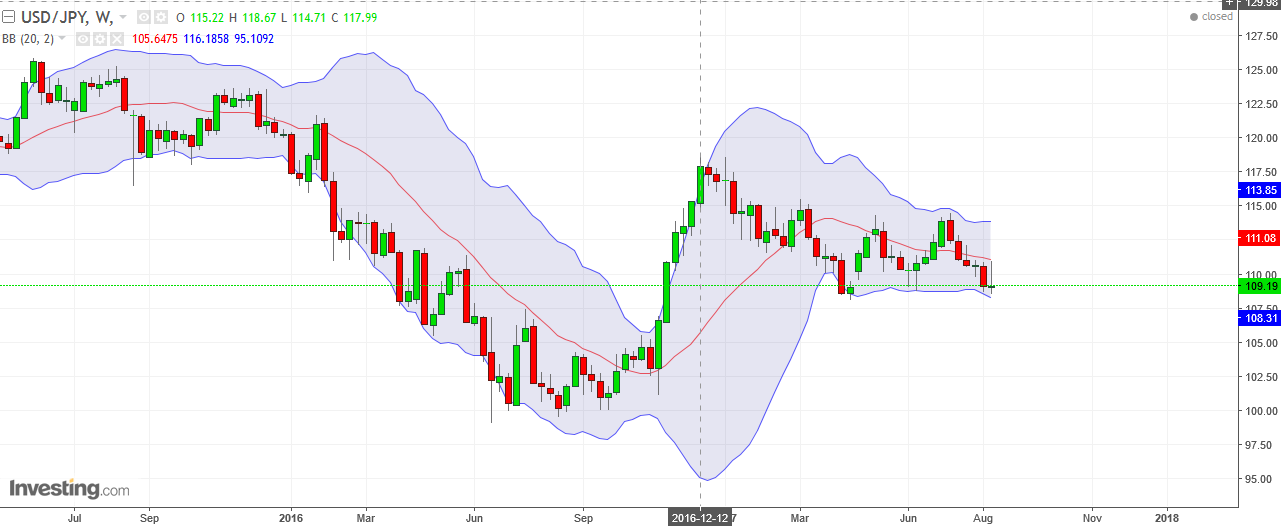
^^Weekly confirmation? ^^
You’ll see the weekly chart is looking dim as well. The lower bollinger is starting to expand downward, and price could end up chasing that bollinger. But currently, 109.00 has been support during 2017 so we’ll have to see if it holds up.
Lastly, we know by now what a continued downward spiral in the USDJPY means for gold.
Thanks NickG,
John Hardy, Head FX @ Saxo Bank put out a similar call last Friday:
“USDJPY is threatening to close the week below its weekly Ichimoku cloud, a development that could see further progression lower, perhaps to the 106.50 or even 105.00 areas, depending on the degree of further risk aversion sweeping over markets. Last range support low 108’s.”
https://www.tradingfloor.com/posts/fx-board-jpy-graps-spotlight-as-risk-aversion-jumps-8892670 …. registration required (well worthwhile).
If there are moves to impeach Trump the dollar could suffer a near collapse.
Others agree, eg
John Williams Warns “A Move To Impeach Trump Will Tank The Dollar”
https://t.co/aAeG5g1WTL
On Nick’s analysis … I like bollies too, especially in various timeframes, but I have a hard time devising consistent trading rules around them (moves outside the 3sd bands are usually good for reversals however). They are great for one off assessments though.