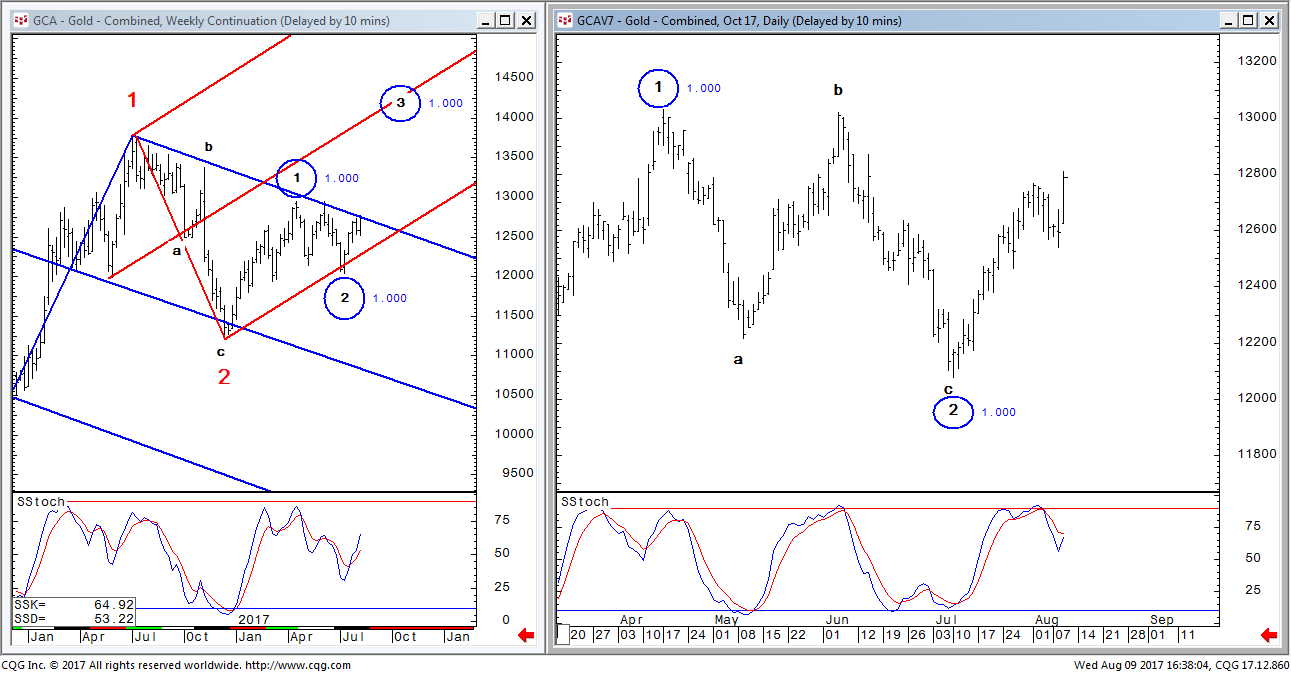
Gold is now at a “Pitchfork in the Road”
Gold – Daily and Weekly basis the October ’17 Comex
August 9, 2017
Support in the 1245 -1250 range. Resistance at 1287 close. We did not see a 3-wave corrective decline from the high of 6 days ago (at least not on a daily chart) so from a wave perspective we are temporarily lost. Tuesday’s low may have been wave-a down of an a-b-c and today’s new high at b part of an irregular correction. If so, a c-wave down to 1255-1260 remains a possibility.
Prices on the weekly chart are sitting on the blue upper pitchfork boundary with weekly momentum rising and daily momentum attempting to cross over to the upside.
A breakout on the weekly above the pattern would be far more important than to have concern over a short term count. That will eventually clear up. As previously mentioned, the circled labeling on the weekly and daily presents one of the more bullish possibilities we have seen in some time.