Dollar Index – Comparisons With The Last 2 Big Breakdowns
The big dollar debate. Dollar dead cat bounce or return of the bull ?
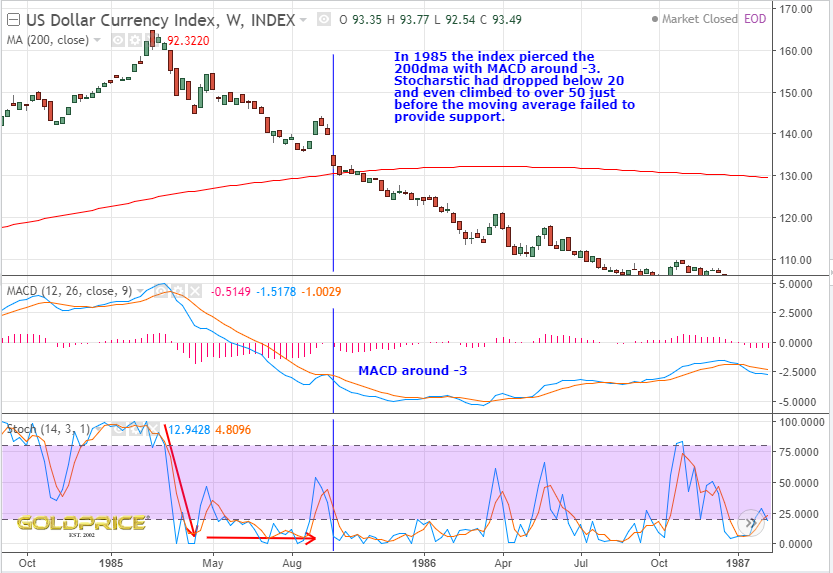
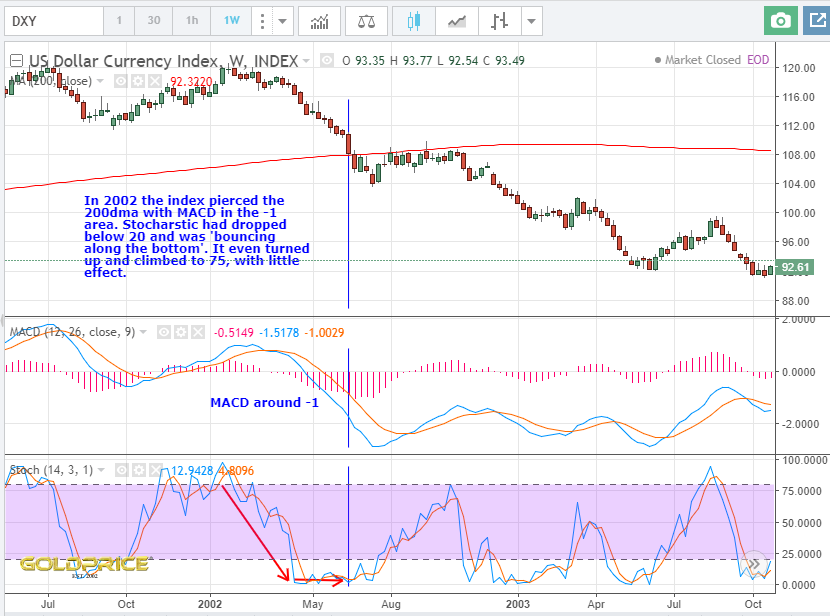
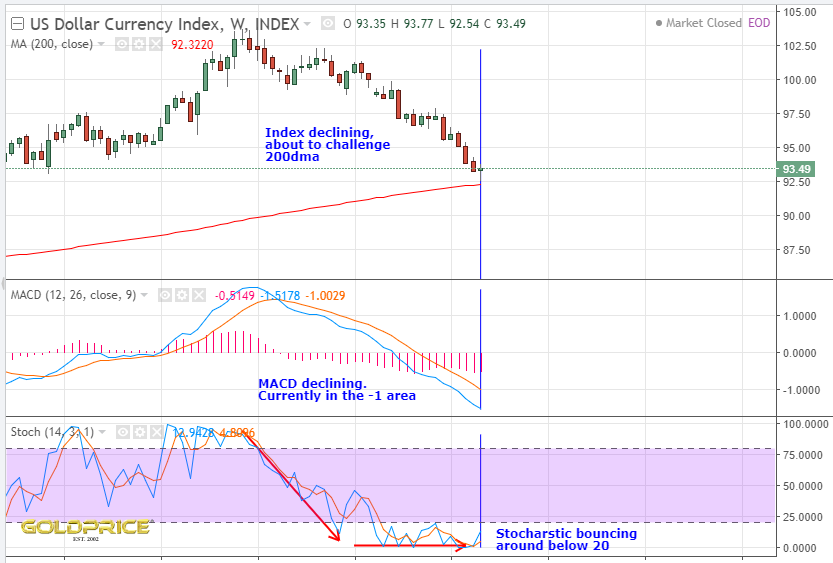
Here are 3 charts for your consideration. The last dollar cycle breakdowns. More specifically, the point at which the 200dma was breached to the downside. In 1985 the 200dma was still rising, in 2002 it was still rising and today it is still rising. The MACD was falling and around -3 in 1985 and -1 in 2002. Today it’s around -1. Stocharstic had fallen sharply in 1985 and 2002, and was bouncing around below 20, today it is doing exactly the same.
Not shown on these charts, but in 1985 and 2002 the TSI had bear crossed weeks/months earlier and was in the -20 area at the point where the 200dma failed . It’s currently at about -20. The TRIX was below zero and declining, like now. %R was below -80 in 1985 and 2002, just as it is now. In short, after looking at numerous indicators, I can’t say for certain that this is just a dead cat bounce, but I can say for certain that all of the indicators are lining up in an almost identical fashion, with almost identical readings and directions of travel as they had in 1985 and 2002 when the 200dma was breached near the start of the cyclical dollar decline.
Great work and Charts thanks NS. Still on fire 🙂
Cheers OJ. It’s no guarantee of future price action, but it does show that, so far, we remain on track with the dollar cycle decline thesis.
Nice analysis NS
Cheers Randy 😉