Another Long Term View
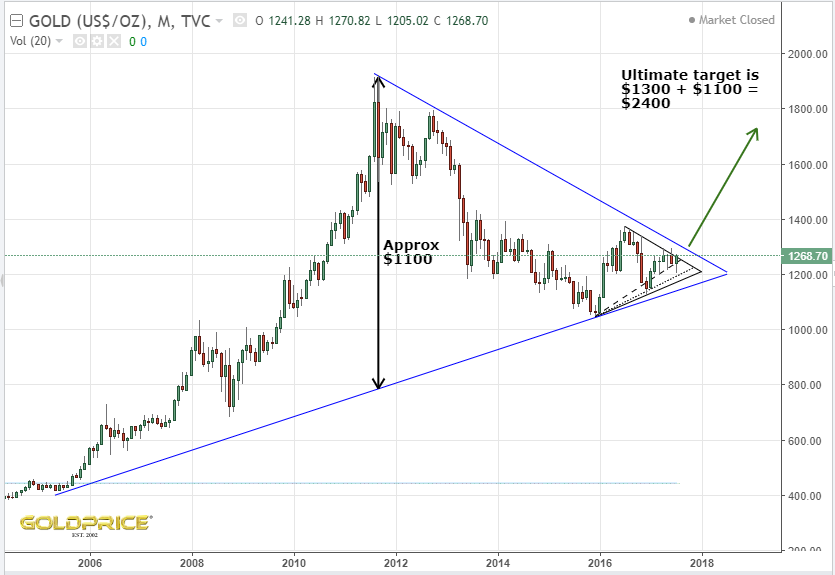
Had a quick look at the gold chart. Depending on how you draw your line, we are just about breaking out of the symmetrical triangle we’ve been building out since the late 2015 lows. The much larger blue symmetrical triangle will show a breakout near $1300, giving us a target of around $2400. Notice that we can turn down and go below $1200 anytime up until early 2018 without damaging this set up.
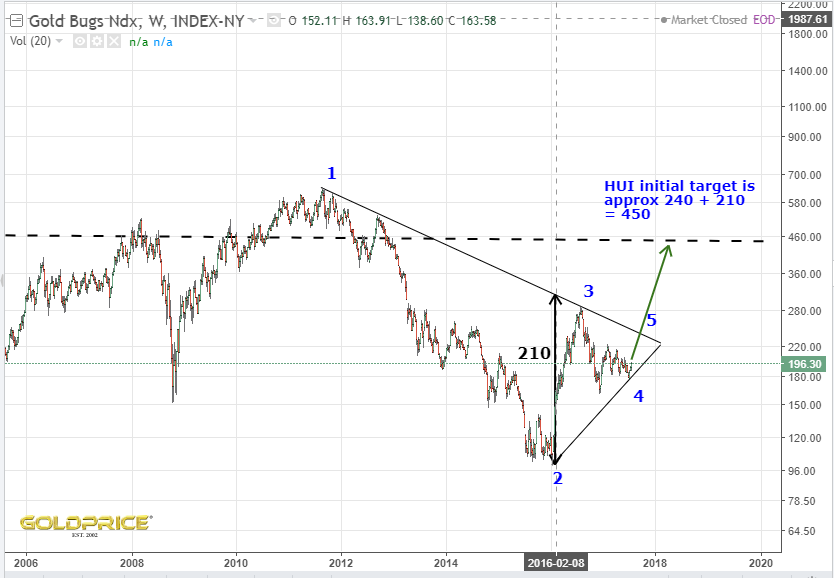
A similar analysis of the HUI position gives us an initial target of 450
I thought I’d have a look at the very long term gold chart again and overlay some indicators…
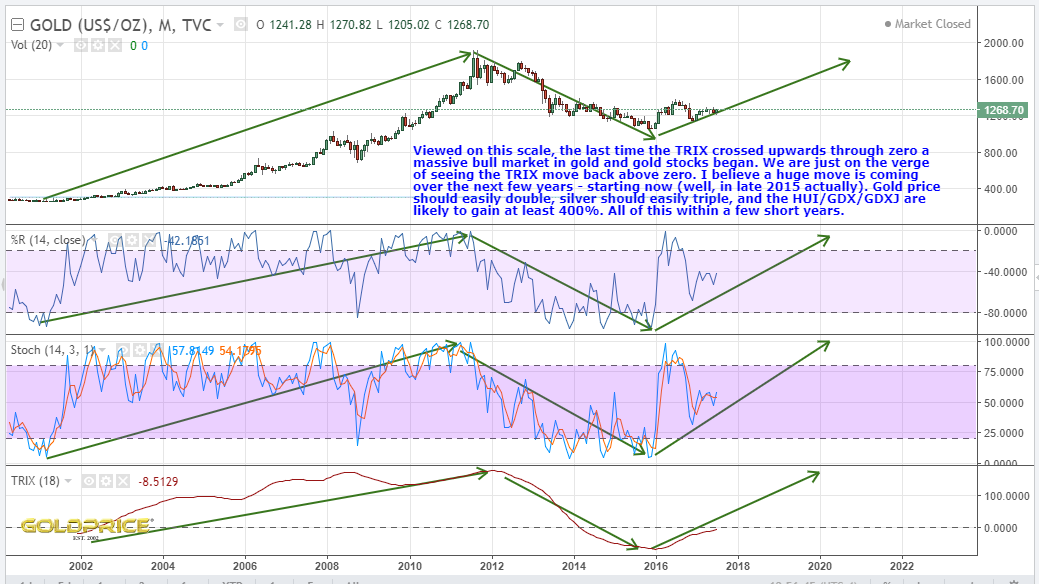
It looks very strongly suggestive of a new, long term bull market being born. Unless any of these very long term support lines are broken to the downside, the strategy has to be long gold and long miners (especially Spocks rocks !).
Brilliant thanks NS. You have definitely stayed on the same message for some time now.
Cheers OJ. Holding your nerve can be very difficult with the PMs, but unless the long term support is broken, we’re on track. There is a ‘weight of evidence’ building now, which supports the gold bull thesis. I’ve invested accordingly, but always listen to the other side of the debate. We’re lucky to have some great posters and a lot of experience in this little tent of ours 😉